SEO SQL Pattern #2: Analyzing performance over time
February 8, 2025
The time dimension is often overlooked in digital analytics. We take it for granted because the whole point of digital marketing is to grow—traffic, customers, and revenue—over time. Performance is inherently a factor of time!
This post follows from the post on Pattern #1, which is all about ranking data and does not take time for granted. In fact, by the end of it, you’ll probably be tired of hearing about it. I’ll introduce four typical ways of thinking about performance with regard to time, and I’ll share my favorite ways to follow these patterns in BigQuery SQL.
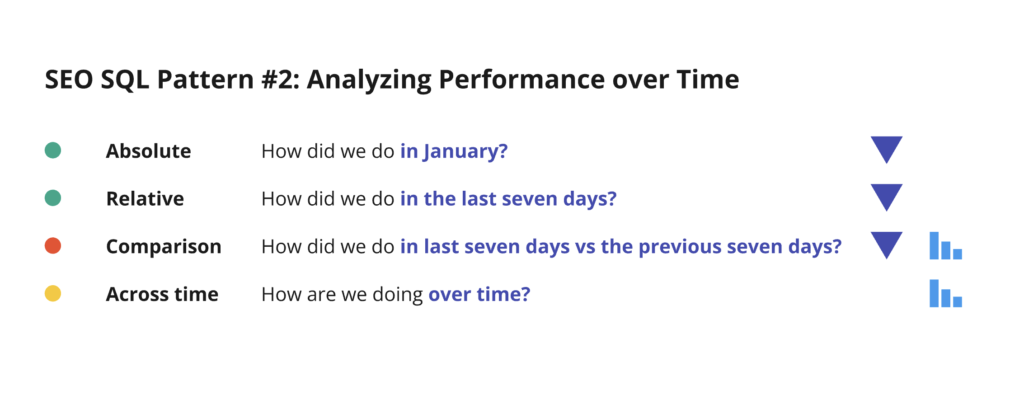
I introduce four sub-patterns: absolute time frame, relative time frames, comparing time frames, and observation in change over time.
Watch the Video Walkthrough
To get the most out of this post, watch the video below, where I walk through each pattern and explain the SQL queries in real time.
Pattern 1: Absolute Time Filtering
Why Use Absolute Time?
An absolute time range is a fixed period, such as a specific month or year. This is useful for static reports, like tracking performance for December 2024 without worrying about shifting dates.
Example Query: Absolute Time Filtering
-- ABSOLUTE time frame
SELECT DATE_TRUNC(data_date, MONTH) SUM(clicks) AS total_clicks, SUM(impressions) AS total_impressions FROM `searchconsole.searchdata_site_impression` WHERE DATE_TRUNC(data_date, MONTH) = '2024-12-01'; -- December 2024 only GROUP BY 1

Things to Remember:
- Absolute time is best for historical reporting (e.g., “How did we perform in January?”)
- I like to use DATE_TRUNC() for intuitive filtering that works on all types of date periods without remembering complex date formatting expressions.
BigQuery DATE_TRUNC Documentation
Pattern 2: Relative Time Filtering
Why Use Relative Time?
Unlike absolute time, a relative timeframe adjusts dynamically based on the current date. This is useful for ongoing monitoring (e.g., “How did we perform in the last 28 days?”).
Example Query: Relative Time Filtering
-- RELATIVE time frame (last 28 days)
SELECT MIN(data_date) min_date, MAX(data_date) max_date, SUM(clicks) AS total_clicks, SUM(impressions) AS total_impressions FROM `searchconsole.searchdata_site_impression` WHERE data_date > CURRENT_DATE() - 28; -- Last 28 days -- WHERE data_date > CURRENT_DATE() - 28 - 3; -- Last 28 days of data (accounting for latency)

What to remember
- Relative time keeps reports up-to-date automatically.
- You can use it to understand performance without waiting until the end of a period
- You will often need to adjust your time window to accommodate for Google Search Console’s latency
Learn about the CURRENT_DATE function
Pattern 3: Aggregating Data Over Time
Why Aggregate Data?
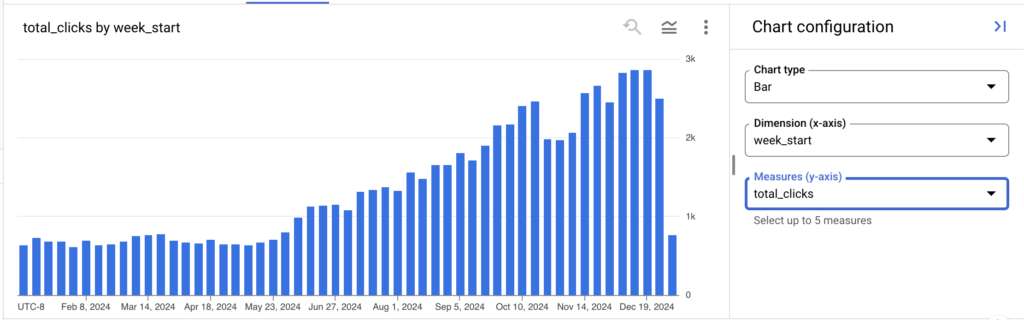
Analyzing SEO data at the daily level can be noisy. Aggregating data by week, month, or quarter helps identify long-term trends.
Example Query: Date Aggregation
-- Aggregate by week
SELECT DATE_TRUNC(data_date, WEEK(MONDAY)) AS week_start, FORMAT_DATE('%Y-%W', data_date) AS week, SUM(impressions) AS total_impressions, SUM(clicks) AS total_clicks FROM `searchconsole.searchdata_site_impression` WHERE data_date BETWEEN '2024-01-01' AND '2024-12-31' -- Full year GROUP BY 1,2 ORDER BY 1;
Things to Remember:
- Aggregation helps smooth out fluctuations in daily data.
- DATE_TRUNC() is easier to use than FORMAT_DATE().
- Choose weekly/monthly/quarterly aggregation based on reporting needs.
Learn about the DATE_TRUNCC function
Pattern 4: Using Rolling Averages to Smooth Trends
Why Use Rolling Averages?
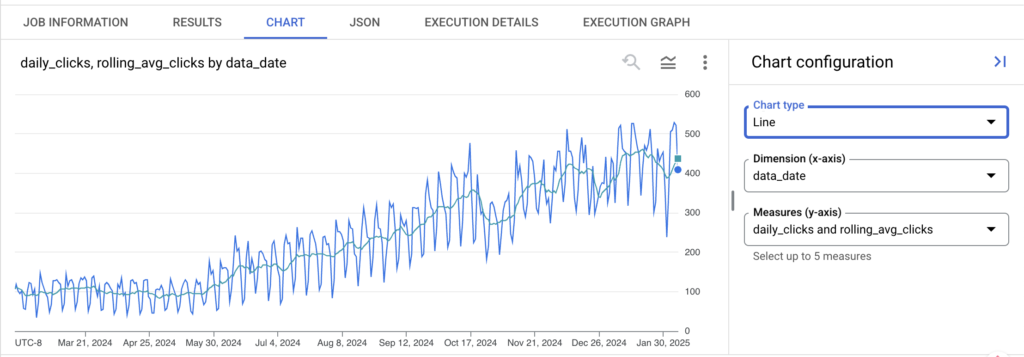
SEO traffic fluctuates daily, making it hard to see clear trends. A rolling average smooths these fluctuations for better insights.
Example Query: 7-Day Rolling Average
-- 7-day rolling average
SELECT data_date, SUM(impressions) AS daily_impressions, AVG(SUM(impressions)) OVER (ORDER BY data_date ROWS BETWEEN 6 PRECEDING AND CURRENT ROW) AS rolling_avg_impressions, SUM(clicks) AS daily_clicks, AVG(SUM(clicks)) OVER (ORDER BY data_date ROWS BETWEEN 6 PRECEDING AND CURRENT ROW) AS rolling_avg_clicks FROM `searchconsole.searchdata_site_impression` WHERE data_date > CURRENT_DATE() - 52 * 7 -- Last year GROUP BY data_date ORDER BY data_date;
Things to Remember:
- Rolling windows remove seasonal effects like weekends or holidays.
- ROWS BETWEEN defines how many past days to include in the moving average, and it’s easy to use because both ends of the BETWEEN keyword are included in the time range.
- Adjust window size (e.g., 14-day or 28-day) based on volatility.
BigQuery Window Functions Documentation
Pattern 5: Comparing SEO Performance Over Time
Why Compare Time Periods?
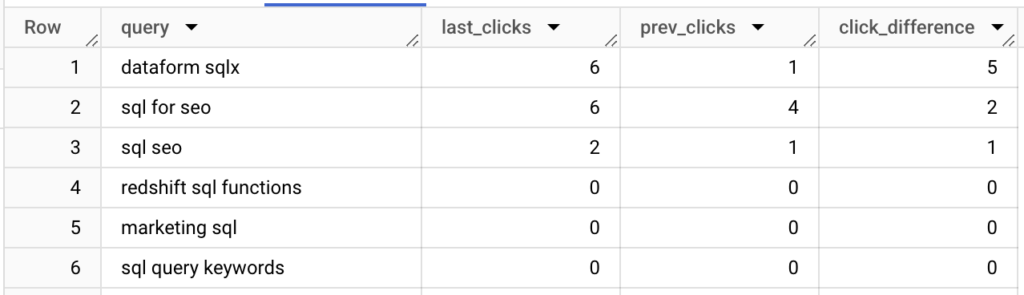
Comparing two time periods helps identify growth, decline, and opportunities.
Example Query: Comparing the Last 28 Days vs. the Previous 28 Days
-- Compare last 28 days vs. previous 28 days
WITH last_28 AS ( SELECT query, SUM(clicks) AS last_clicks, SUM(impressions) AS last_impressions FROM `searchconsole.searchdata_site_impression` WHERE data_date BETWEEN CURRENT_DATE() - 28 AND CURRENT_DATE() GROUP BY query ), previous_28 AS ( SELECT query, SUM(clicks) AS prev_clicks, SUM(impressions) AS prev_impressions FROM `searchconsole.searchdata_site_impression` WHERE data_date BETWEEN CURRENT_DATE() - 56 AND CURRENT_DATE() - 29 GROUP BY query ) SELECT l.query, l.last_clicks, p.prev_clicks, l.last_clicks - p.prev_clicks AS click_difference FROM last_28 l LEFT JOIN previous_28 p ON l.query = p.query ORDER BY click_difference DESC;
Things to Remember:
- Identifies top-growing and declining pages or queries.
- Uses WITH statements (CTEs) for cleaner comparisons.
- Sorting by click_difference surfaces weaknesses and opportunities
BigQuery Common Table Expressions (CTE) Documentation
Final Thoughts
Hopefully, now, when you wonder, “How did we perform last week vs the previous week,” you’ll identify the pattern for analysis and be able to quickly write the SQL to find the answer.
Take Your SQL Skills to the Next Level
Sign up for the SQL for SEO Course to become a better analyst than 99% of SEOs!