SEO SQL Pattern #1: Aggregating Position Metrics and CTR Curves
January 4, 2025
Google Search Console only provides a few metrics: impressions, clicks, CTR, and average position. The first three are easy to understand, but the average position can trip up even the savviest analyst if they’re not careful. That’s why I started this series on SQL Patterns for SEO with a (perhaps overly) thorough explanation of how to aggregate and analyze the position metrics.
I’ll describe the sum_top_position (and sum_position) metric, explain how and why it’s stored that way, and how to calculate average position and analyze CTR curves correctly.
What is sum_top_position?
Google Search Console data includes a metric called sum_top_position, which often confuses users. Google describes it as the “sum of the topmost position of the site in the search results for each impression in that table row, where zero is the top position in the results.”
Want to understand GSC data better than 99% of SEOs?
Sign up for my course about SQL for SEO with BigQuery and check out the GSC Performance Metrics Deep Dive section.
Let’s get into more detail.
How is it stored?
sum_top_position represents the sum of the topmost positions for your site in search results for each query. For example, if your site’s topmost position in three impressions is 4, 6, then 7, the sum_top_position will be stored as 17 (4 + 6 + 7).
To complicate matters, Google uses a zero-based index for positions. A position of 5 is stored as 4, which means you must always add 1 to derive the correct position.
Why is it stored this way?
The design facilitates aggregation. Instead of averaging positions (which requires complex de-weighting), summing positions simplifies calculations like weighted averages, enabling efficient aggregation of large datasets.

How do you calculate average position using sum_top_position?
There are two ways to calculate average position: the right way and the anti-pattern.
The Right Way:
To correctly calculate the average position, divide sum_top_position by the total number of impressions and add 1 to account for the zero-based indexing. Here’s an example query:
-- PATTERN #1.1: Aggregating Average Position
with queries as ( select query, sum(clicks) as total_clicks, sum(impressions) as total_impressions, sum(clicks) / nullif(sum(impressions), 0) as ctr, sum(sum_top_position) total_sum_top_position, -- This metric is meaningless on its own... sum(sum_top_position) / sum(impressions) + 1 as avg_position from `searchconsole.searchdata_site_impression` where data_date between date_sub(current_date, interval 30 day) and current_date - 2 group by query order by 2 desc )
select sum(q.total_clicks), sum(q.total_impressions), sum(q.total_clicks) / nullif(sum(q.total_impressions), 0) as ctr, avg(avg_position) anti_pattern, sum(q.avg_position * q.total_impressions) / sum(q.total_impressions) avg_position1, sum(total_sum_top_position) / sum(total_impressions) + 1 avg_position2 from queries q
The Anti-Pattern:
Averaging avg_position directly without weighting by impressions is incorrect. This method skews the result because it calculates the mean of averages rather than a true weighted average. For instance, averaging positions without considering impressions would result in misleading metrics.
Introducing CTR Curves
Another way to analyze your site’s search position in aggregate is to create CTR curves. These provide insights into user behavior at different positions in search results.
**Why Use CTR Curves?
**CTR curves illustrate how click-through rates decrease as the SERP position increases. For example, a typical CTR for position one might be 31%, while position two might drop to 14% and position 3 to 10%.
Here’s how to generate a CTR curve:
-- PATTERN #1.2: CTR Curves
with queries as ( select query, sum(clicks) as total_clicks, sum(impressions) as total_impressions, sum(clicks) / nullif(sum(impressions), 0) as ctr, sum(sum_top_position) total_sum_top_position, sum(sum_top_position) / sum(impressions) + 1 as avg_position from `searchconsole.searchdata_site_impression` where data_date between date_sub(current_date, interval 30 day) and current_date - 2 -- and query like '%consult%' group by query )
select round(avg_position) position, sum(q.total_impressions), sum(total_clicks) / nullif(sum(total_impressions), 0) as ctr from queries Q group by 1 order by 1 limit 30
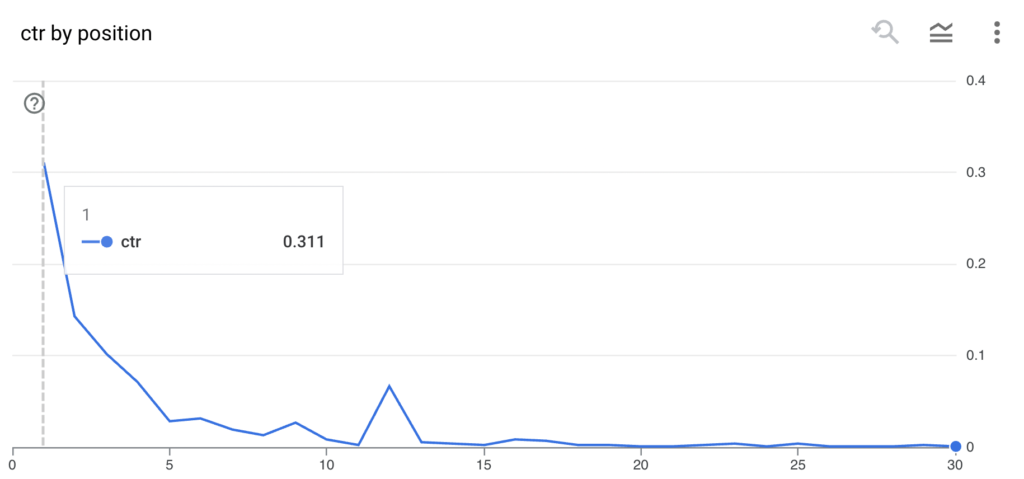
Charting the CTR curve data from above using BigQuery’s native charting feature.
Why You Need to Be Careful with CTR Curves
CTR curves vary significantly by query type, search intent, and competition. For instance, a non-commercial query like “what comes after gamma” might have a high CTR (e.g., 43% in position 1), while competitive commercial queries like “consulting” might have low CTRs even at top positions.
Here’s an example from my data (see the video):
- Queries containing “date” yielded a CTR of 43% in position 1.
- Queries containing “consult” had a CTR below 1% in top positions due to high competition.
CTR Curves to Model Position Change:
CTR curves can help estimate the impact of rank improvements. For example, moving a query from position three to position one could double the CTR. However, this is only reliable for queries with CTR curves that aggregate queries similar to the query of interest.
Conclusion
Understanding sum_top_position and CTR curves is essential for effective Google Search Console data analysis. By correctly aggregating positions and using CTR curves mindfully, you can uncover actionable insights and model the potential impact of ranking changes. Have questions or insights to share? Feel free to reach out, and let’s discuss further!