LinkedIn Analytics Tools for Creators Who Mean Business
April 16, 2026
Last year, I was working with a B2B SaaS client whose founder had been posting on LinkedIn consistently for months. We had a hunch it was working — demo requests seemed to spike after certain posts. but we couldn’t prove it. The CRM showed booked calls, LinkedIn showed likes. But there was no way to connect the two.
I wanted to build a simple spreadsheet: post dates in one column, booked demos in the other. See if the patterns held up. But when I went to pull the post dates, I hit a wall. LinkedIn doesn’t show them. It shows “2w” or “3mo.” I couldn’t even get the raw dates I needed to start.
That sent me down a rabbit hole. I figured out that LinkedIn encodes a timestamp in every post ID, built a post date extractor to decode them, and then built a Google Sheets tracker so I could pull post metadata for any profile. I used spreadsheets like that for months.
Eventually I wanted something that would just tell me what’s working and why without the manual upkeep. So I built Flux. That was over six months of iteration from the first spreadsheet to a working product.
Along the way, I researched a lot of LinkedIn analytics tools. Here’s what I learned.
TL;DR: Most LinkedIn analytics tools are built for company pages, not individual creators. If you’re a solo creator trying to figure out what’s working, your best options are Flux ($5/mo or $30/yr), a DIY spreadsheet with my free post date extractor, or AuthoredUp ($20/mo, writing-focused with analytics secondary). Shield, the longtime dashboard favorite, is winding down in 2026. The right choice depends on whether you want a digest, a dashboard, or to build it yourself.
The Problem with LinkedIn Analytics in 2026
In 2026, there are more LinkedIn analytics tools than ever and in my estimation, most are built for the wrong audience.
Company page analytics — tools like Hootsuite, Sprout Social, and Buffer that help marketing teams track branded content across multiple social platforms. These tools are deep, expensive, and built for teams.
Personal profile analytics — tools for individual creators who want to know which of their posts are resonating and why. This is a fundamentally different problem, and most comparison articles don’t distinguish between the two.
If you’re a solo creator posting 3-5 times a week to build your business, a $200/month social media management suite isn’t what you need. You need answers to three questions:
- What topics resonate with my audience?
- When should I be posting?
- Am I getting better over time, or just guessing?
Most tools are built to answer question 1 (sort of) and question 2 (sometimes). Almost none help with question 3.
What LinkedIn Actually Shows You (and What It Doesn’t)
What LinkedIn’s native analytics give you:
- Impressions, reactions, comments, and reposts for each post
- Follower demographics (job title, industry, location)
- Profile views and search appearances
- Post performance over the last 90 days (not 365 — it’s actually worse than most people think)
What LinkedIn does NOT give you (and no tool can magic up):
- Who specifically viewed your post (you get aggregated demographics, not names)
- Click-through rates on links in personal posts
- How your content compares to other creators in your niche
- Any data older than 90 days through the native dashboard
That last point matters: if you don’t capture your data somehow, it disappears. Any tool that starts tracking “from today forward” has the same problem.
What about the LinkedIn API? LinkedIn’s Marketing API is built for company pages — campaign management, ad reporting, lead gen, and page analytics. It does not expose personal profile post analytics. There is no official way for individual creators to automatically pull their own post data.
So how do third-party tools get your personal data? It depends:
- Chrome extensions (AuthoredUp) — scrape data from the LinkedIn interface while you’re logged in
- Login connections (Shield) — access your account data after you sign in with LinkedIn
- Public post analysis — Flux takes a different approach: it analyzes publicly visible post data, so there’s no login or extension needed
This matters because the data access method determines what a tool can show you, what permissions you’re granting, and how much friction is involved in getting started.
The Honest Comparison: Which Tool for Which Creator
Pick the row that matches your situation:
| If you… | Consider | Price | Why |
|---|---|---|---|
| Just want to know what’s working, zero setup | Flux | $5/mo or $30/yr | Paste a URL — yours or anyone else’s — and get a full-history dashboard plus a weekly email with what’s working. No login needed. |
| Want maximum control and don’t mind manual work | DIY: Spreadsheet + extractor | Free | Use the post date extractor and Google Sheets tracker to build your own system. |
| Were relying on Shield’s deep dashboards | Shield | Winding down | Shutting down in 2026 after LinkedIn enforcement. Don’t start here — existing users should export their data now. |
| Want writing tools + analytics in one place | AuthoredUp | ~$20/mo | Built around a Chrome extension. Strong on drafting and formatting, with analytics secondary. |
| Want a growth/AI suite with analytics included | Taplio | $39-199/mo | AI writing, scheduling, lead database, and analytics. Analytics is one of 50+ features. |
| Need a full social media management suite | Hootsuite or Buffer | $50-200+/mo | Built for marketing teams managing company pages. Overkill for individual creators. |
| Just want the basics for free | Native LinkedIn | Free | Good enough for casual checking. Limited to 90 days of history. No export, no trends. |
Here’s the honest rundown on each.
Flux
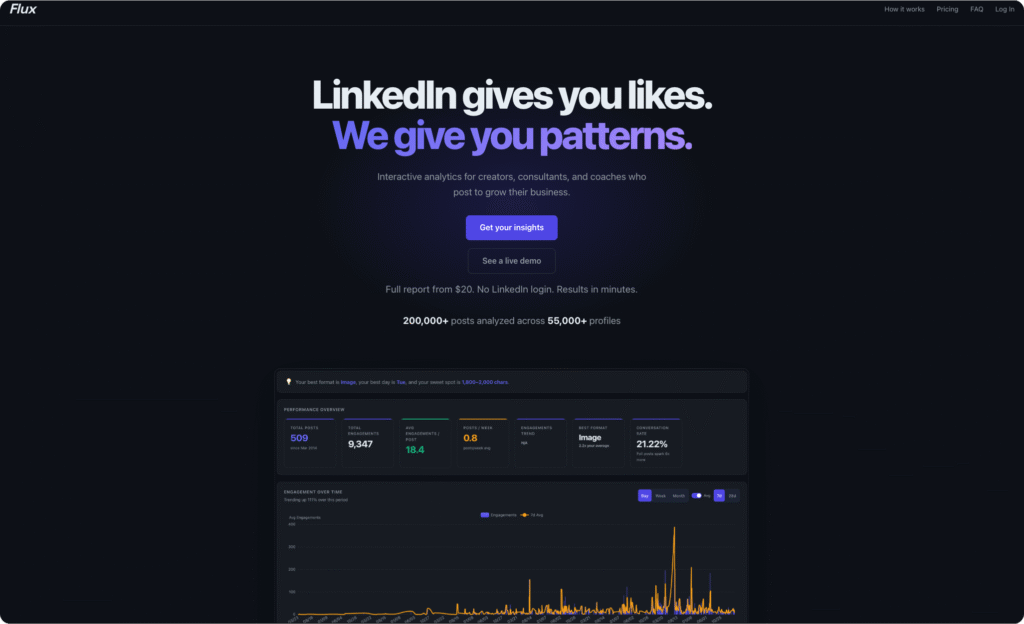
Full disclosure: I built this. But… I built it because none of the other tools solved my original problem: understanding what’s working across my entire post history with a simple setup and insights that would actually help me improve performance.
You paste a LinkedIn profile URL — yours, a peer’s, or a competitor’s — no login, no extension, no permissions. It analyzes every post ever made on that profile (not just the last 90 days) and gives you an interactive dashboard with engagement trends, format breakdowns, posting heatmaps, top posts, and CSV export. You also get a weekly email digest so you don’t have to log in to stay on top of what’s working. This works on any public profile, which is what makes it useful for benchmarking yourself against other creators in your niche — not just tracking your own numbers.
Pricing comes in two tiers. Pulse is $5/month or $30/year: the full-history dashboard, automatic weekly refreshes, and the email digest. Edge is $15/month or $150/year and adds an intelligence layer — bulk research on any public profiles (peer and competitor benchmarking at scale), predictive scoring of drafts against your own historical performance, semantic search across everything you’ve written, and a Claude-ready MCP API. Every Pulse plan includes a free trial of Edge. Limitations: it works with publicly available post data, so it can’t show impression counts or audience demographics that LinkedIn keeps behind its login wall. It also works for company pages, not just personal profiles.
Where it’s headed: the problem that started this whole journey — connecting LinkedIn activity to actual business outcomes — is still largely unsolved by any tool. I’m actively building toward that: measuring posts against business results, developing audience strategies, identifying leads who engage with your content.
Right now, Flux is crossing from insights to action. It offers an MCP connection if you like to write your posts with AI and a post grader to maximize your posts engagement.
Early users get to shape what that looks like. If that’s interesting, try Flux and email me what you’d want it to do.
DIY: Spreadsheet + Post Date Extractor
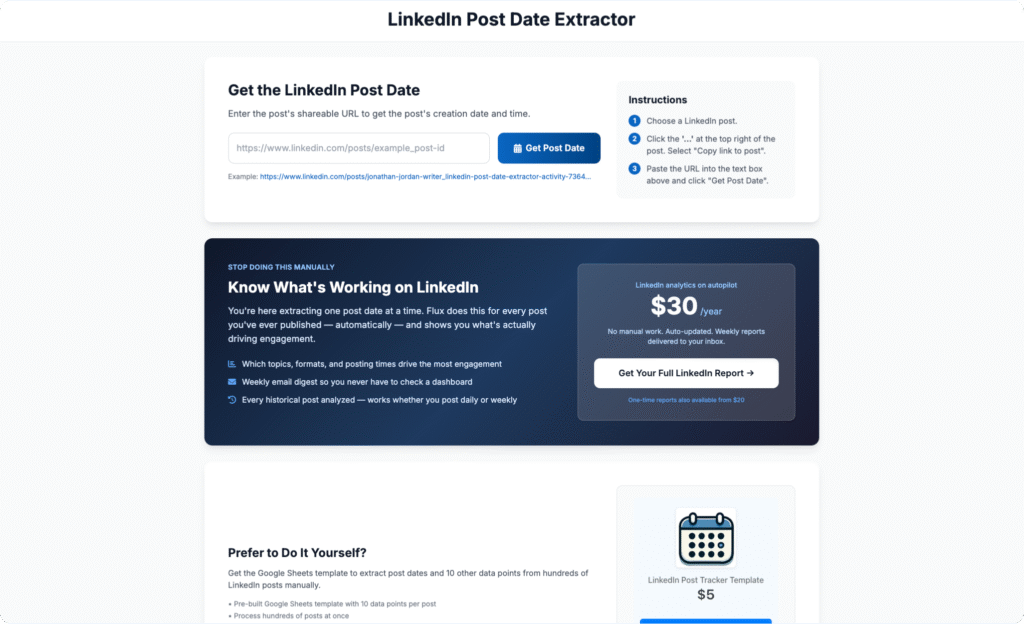
This is where I started, and it’s still a solid option if you want full control. The LinkedIn post date extractor decodes the timestamp hidden in every LinkedIn post URL, and the accompanying Google Sheets template lets you track posts, engagement, and metadata over time.
The upside: it’s free, you own the data, and you can customize it however you want. The downside: it’s manual. You’re copying URLs, pasting them in, and updating engagement numbers yourself. For 3-4 posts a week, that’s about 15 minutes of work each week. Sustainable, but not passive.
Native LinkedIn Analytics
The built-in analytics are fine for a quick glance. You can see impressions and reactions on individual posts, and the profile-level analytics show follower demographics.
The limitations: your post performance data disappears after about 90 days. There’s no way to see trends over time, no topic or format breakdown, and no export. If you post 4 times a week, that’s roughly 50 posts of history before it starts vanishing.
Shield
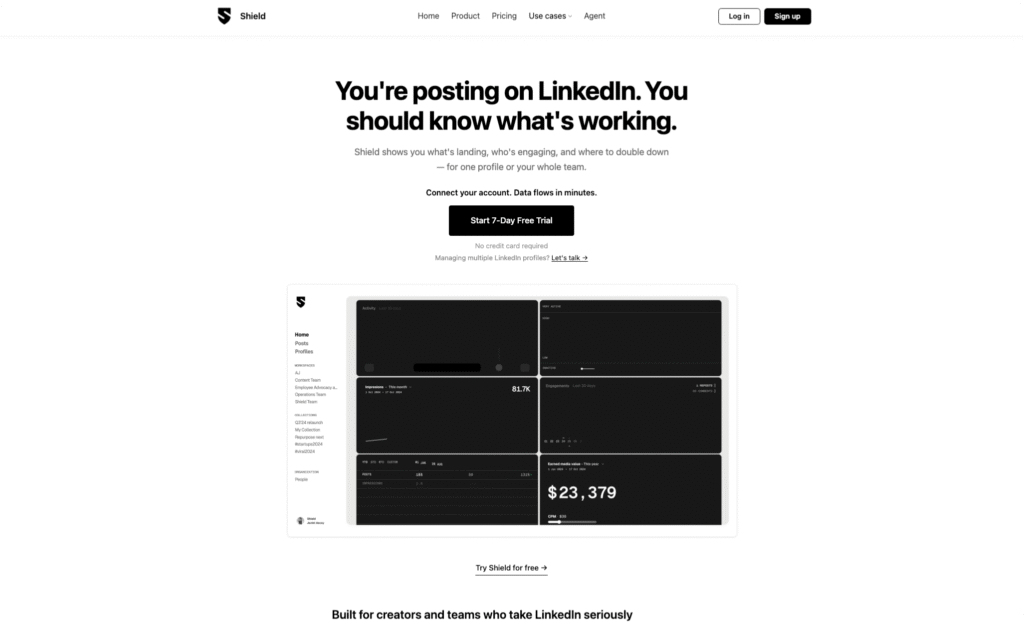
Update, July 2026: Shield is winding down. LinkedIn’s enforcement against its extension-based data collection ended it — the extension was pulled from the Chrome Web Store, and the founders chose not to fight. New signups no longer make sense, and if you’re an existing user, export your post and analytics data as CSV now, before account access closes.
The original write-up, for context: Shield was the most established LinkedIn-specific analytics tool, with detailed engagement metrics, audience growth tracking, and content performance breakdowns. At $25-30 per profile per month, it was the deep-dashboard option — and its shutdown is exactly the risk of tools built on scraping your logged-in session. Tools that analyze public data (Flux, the DIY spreadsheet) don’t have that dependency.
AuthoredUp
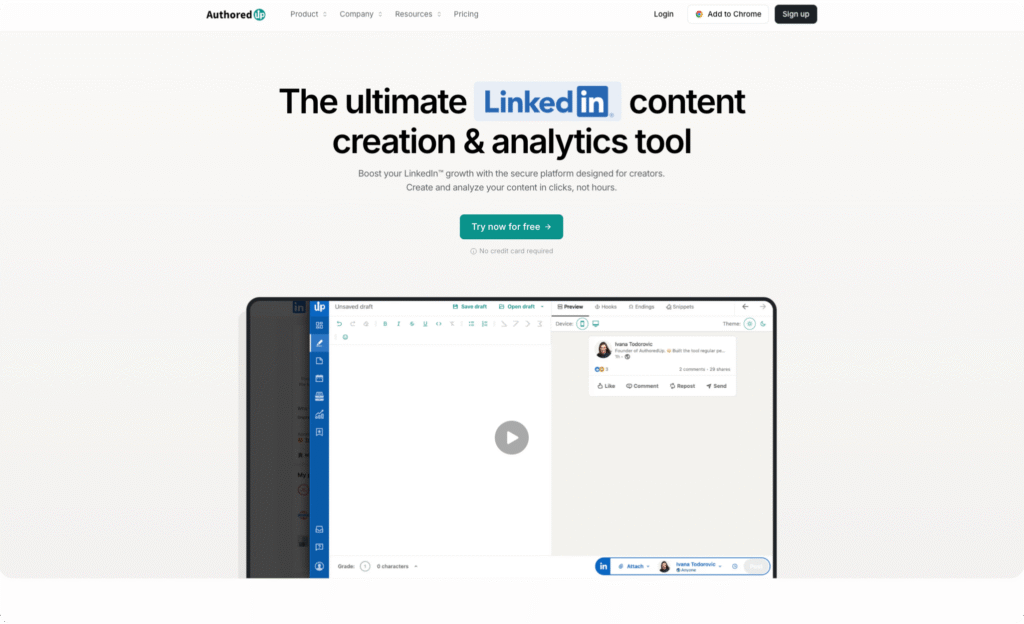
AuthoredUp is primarily a content creation tool — drafting, formatting, hook templates — with analytics as a secondary feature. It’s built around a Chrome extension (they now also have a web platform), which means it’s integrated into your LinkedIn workflow.
The analytics show post performance, formatting effectiveness, and some historical data. Good fit if you want writing assistance and analytics in a single tool. Less useful if you only want the analytics.
Taplio and Supergrow
Both are “LinkedIn growth suites” that bundle AI writing, scheduling, engagement tools, lead databases, and analytics into one platform. Taplio runs $39-199/mo, Supergrow $15-139/mo.
The analytics in both are fine but not their main selling point. If you specifically want analytics, you’re paying for a lot of features you won’t use. If you want the whole creator toolkit, they’re worth evaluating.
What to Actually Do with the Data
Here’s the part every “best analytics tools” article skips: what to do once you have the numbers.
Whether you use a tool or a spreadsheet, the weekly check is the same:
1. Spot your top-performing topics. Look at the last 30-90 days. Group your posts by topic or theme. Which topics consistently outperform your average? Those are your audience’s signal — do more of that.
2. Check format effectiveness. Are your text-only posts outperforming carousels? Are short posts beating long ones? Don’t assume — let the data tell you. I’ve seen creators discover that their carefully designed carousels were getting half the engagement of their off-the-cuff text posts.
3. Look for patterns in what drives conversations. Cross-reference your best-performing posts with when leads or DMs came in. No tool does this automatically yet — but knowing your top content makes the pattern directionally obvious. With my SaaS client, we found that educational posts drove roughly 3x more booked demos than opinion posts. The opinion posts got more likes, but they didn’t lead anywhere. We only saw that because we had post dates lined up against CRM data in a spreadsheet. It was manual, but it changed how we thought about content. This is exactly the kind of workflow I’m building into Flux — if you’re doing this manually today, I’d love to hear how.
4. Adjust and repeat. Shift your content mix toward what works. Test new angles on proven topics. Check back in 4 weeks.
The point isn’t to obsess over metrics. It’s to spend 5 minutes a week understanding whether your creative effort is going in the right direction.
FAQ
Can I track my LinkedIn without giving an app access to my account?
Yes. Flux analyzes your public post data — no login, no connection, no Chrome extension. The DIY spreadsheet approach also requires no special access. The tradeoff is that without account access, you won’t get impression data or audience demographics beyond what’s publicly visible.
Are LinkedIn analytics tools worth paying for?
It depends on how much you post and what you’re trying to achieve. If you post once a week for personal branding, native LinkedIn is probably fine. If you post 3-5 times a week and LinkedIn is a meaningful channel for your business, understanding your content patterns will save you time and improve results. Whether that’s worth $30 or $300 a year depends on your budget and how much time you’re currently spending guessing.
What metrics should creators actually track?
Focus on patterns over individual numbers: Which topics get the most engagement relative to your average? What format works best for your audience? When do your posts get the most traction? Is your overall trend up, flat, or down? These patterns matter more than any single metric because they tell you what to do differently next Monday morning.
That’s the honest landscape. If you want the simple version: try native LinkedIn first. If you outgrow it, pick the tool that matches how you like to work — dashboard + email digest (Flux), extension (AuthoredUp), or spreadsheet (DIY).
If you just need post dates to get started, the extractor is free.
And if you’re a creator who’s trying to connect your LinkedIn activity to actual business results — that’s the problem I’m most interested in solving. Try Flux, and tell me what’s missing. I’m building this in the open and early users are shaping the roadmap.