The final two SQL patterns posts focus on the core components of search: content and keywords. Today we’ll analyze how content (URLs) attracts traffic from search, and we’ll wrap up the series by analyzing how users search for that content.
The URL dimension is perhaps the most important dimension in SEO because it represents the only part of search you have complete control over: the content you create and optimize. Analyzing URL performance reveals the patterns behind the kinds of content Google deems to be best suited to search demand, and where opportunities or issues may be hiding.
The best way to illustrate the challenging relationship between your content, the search engine, and the searcher is to examine how search traffic is distributed across your pages. Are a few URLs dominating impressions and clicks? Or is traffic more evenly spread across your content library?
So let’s first ask: How is traffic distributed across your site’s URLs?
How is traffic distributed across your site?
A quick way to answer this question is to rank your site’s URLs by total impressions and split them into equal-sized buckets, or ntiles. These could be quintiles (five groups), deciles (ten groups), or any other segmentation you choose. This approach lets you build a histogram-style view of how impressions and clicks are distributed across all indexed pages, from top performers to low-visibility content.
WITH recent_date AS (
SELECT MAX(data_date) AS max_date
FROM `searchconsole.ExportLog`
WHERE namespace = 'SEARCHDATA_URL_IMPRESSION'
),


url_totals AS (
SELECT
  url,
  SUM(impressions) AS total_impressions,
  SUM(clicks) AS total_clicks
FROM `searchconsole.searchdata_url_impression`, recent_date
WHERE data_date BETWEEN DATE_SUB(max_date, INTERVAL 28 DAY) AND max_date
GROUP BY url
),


ranked_urls AS (
SELECT
  url,
  total_impressions,
  total_clicks,
  NTILE(10) OVER (ORDER BY total_impressions DESC) AS impression_decile
FROM url_totals
)


SELECT
impression_decile,
COUNT(*) AS url_count,
SUM(total_impressions) AS impressions_in_decile,
SUM(total_clicks) AS clicks_in_decile
FROM ranked_urls
GROUP BY impression_decile
ORDER BY impression_decile;
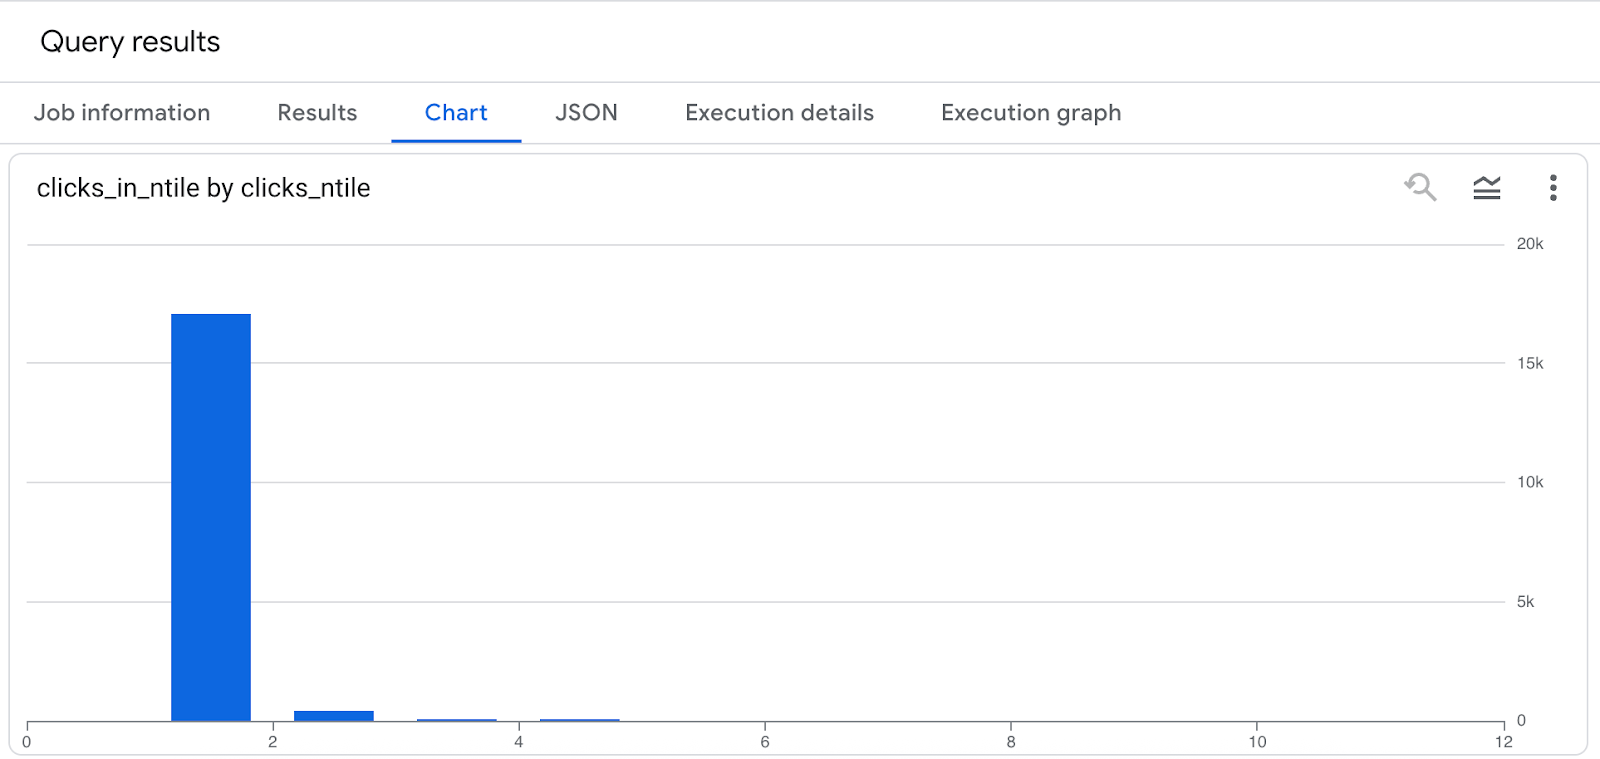
This query produces a table that can be visualized as a histogram—a histogram that often tells a discouraging story.
Site search traffic histogram

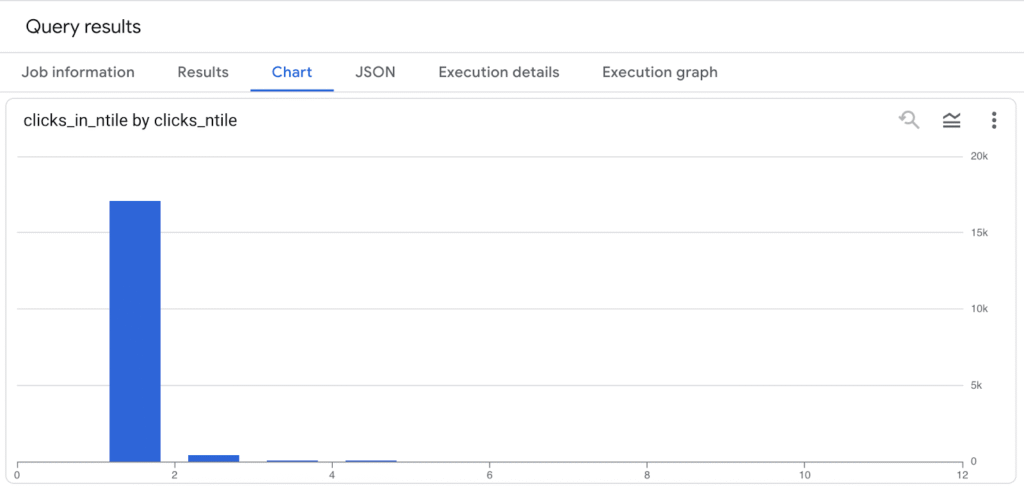
In my site’s case, the click distribution is really lopsided. The top 10% of URLs account for nearly all search traffic—over 17,000 clicks and 369,000 impressions—while the second decile drops off sharply, and by the time we reach the bottom 40% of URLs, there are zero clicks at all. This reveals a classic power-law pattern where a small slice of content drives nearly all visibility, and a large portion of the site is essentially invisible in search. It’s a clear signal to double down on what’s working, identify and address what’s not, and consider whether low-performing URLs should be improved, consolidated, or removed to strengthen the site’s overall SEO footprint.
While ntiles are a helpful overview, we can use BigQuery’s massive compute power to get into granular levels of detail to see how many URLs are responsible for any arbitrary amount of traffic. This query shows the same thing as the last, but at the URL level and it adds a little spice by calculating the running of traffic as a percent of all the traffic.
WITH recent_date AS (
 SELECT MAX(data_date) AS max_date
 FROM `searchconsole.ExportLog`
 WHERE namespace = 'SEARCHDATA_URL_IMPRESSION'
),


url_totals AS (
 SELECT
   url,
   SUM(impressions) AS total_impressions,
   SUM(clicks) AS total_clicks
 FROM `searchconsole.searchdata_url_impression`, recent_date
 WHERE data_date BETWEEN DATE_SUB(max_date, INTERVAL 28 DAY) AND max_date
 GROUP BY url
),


site_total AS (
 SELECT SUM(total_clicks) AS site_clicks FROM url_totals
)


SELECT
 row_number() over (order by total_clicks desc) row_num,
 url,
 total_impressions,
 total_clicks,
 SUM(total_clicks) OVER (ORDER BY total_clicks DESC) AS running_total_clicks,
 ROUND(100 * SUM(total_clicks) OVER (ORDER BY total_clicks DESC) / site_total.site_clicks, 2) AS running_click_pct
FROM url_totals, site_total
ORDER BY total_clicks DESC;

As you can see only 12 of my ~160 pages that have received impressions delivered 95% of all the site’s search traffic.
Introducing window functions (cummulative sums)
In the query, the SUM(total_clicks) OVER (ORDER BY total_clicks DESC) is a window function that calculates a running total of clicks as we move from the highest-clicked URL to the lowest. This means each row shows the cumulative clicks from all higher-ranked URLs, giving us a sense of how quickly clicks accumulate. By dividing that running total by the site-wide total clicks (from the site_total subquery), we also compute a running percentage, showing what share of total search traffic is captured by the top URLs. This is a powerful way to visualize traffic concentration across your content.
URL segmentation for exploration and reporting
Once it’s clear that not all URLs are created equal in the eyes of Google, the next question is: what kinds of URLs perform best?
Segmenting URLs by content type or topic strikes a good balance between site-wide and single-URL analysis to understand how different sections of your site contribute to total traffic.
While it is possible to perform this analysis in Google Search Console, you are limited to just one or two segments at a time. This example will show you how to assign all your site’s content to segments to observe aggregate performance.
Segmenting URLs by path prefix
One simple yet powerful way to segment your site is by the first directory path in each URL. This approach gives you a high-level view of how major sections of your site perform in search—like /blog/, /products/, or /help/—without needing to manually define each category.
Here’s a query that groups clicks and impressions by the first directory path:
WITH recent_date AS (
 SELECT MAX(data_date) AS max_date
 FROM `searchconsole.ExportLog`
 WHERE namespace = 'SEARCHDATA_URL_IMPRESSION'
),


grouped_urls AS (
 SELECT
   SPLIT(REGEXP_REPLACE(url, r'^https?://[^/]+', ''), '/')[OFFSET(1)] AS first_path,
   SUM(clicks) AS total_clicks,
   SUM(impressions) AS total_impressions,
   COUNT(distinct url) total_urls,
   round(SUM(impressions) / COUNT(distinct url),1) impressions_per_url
 FROM `searchconsole.searchdata_url_impression`, recent_date
 WHERE data_date BETWEEN DATE_SUB(max_date, INTERVAL 28 DAY) AND max_date
 GROUP BY first_path
)


SELECT
 IFNULL(first_path, 'root_or_uncategorized') AS url_section,
 total_clicks,
 total_urls,
 total_impressions,
 impressions_per_url
FROM grouped_urls
where first_path like '2%'
ORDER BY total_clicks DESC;
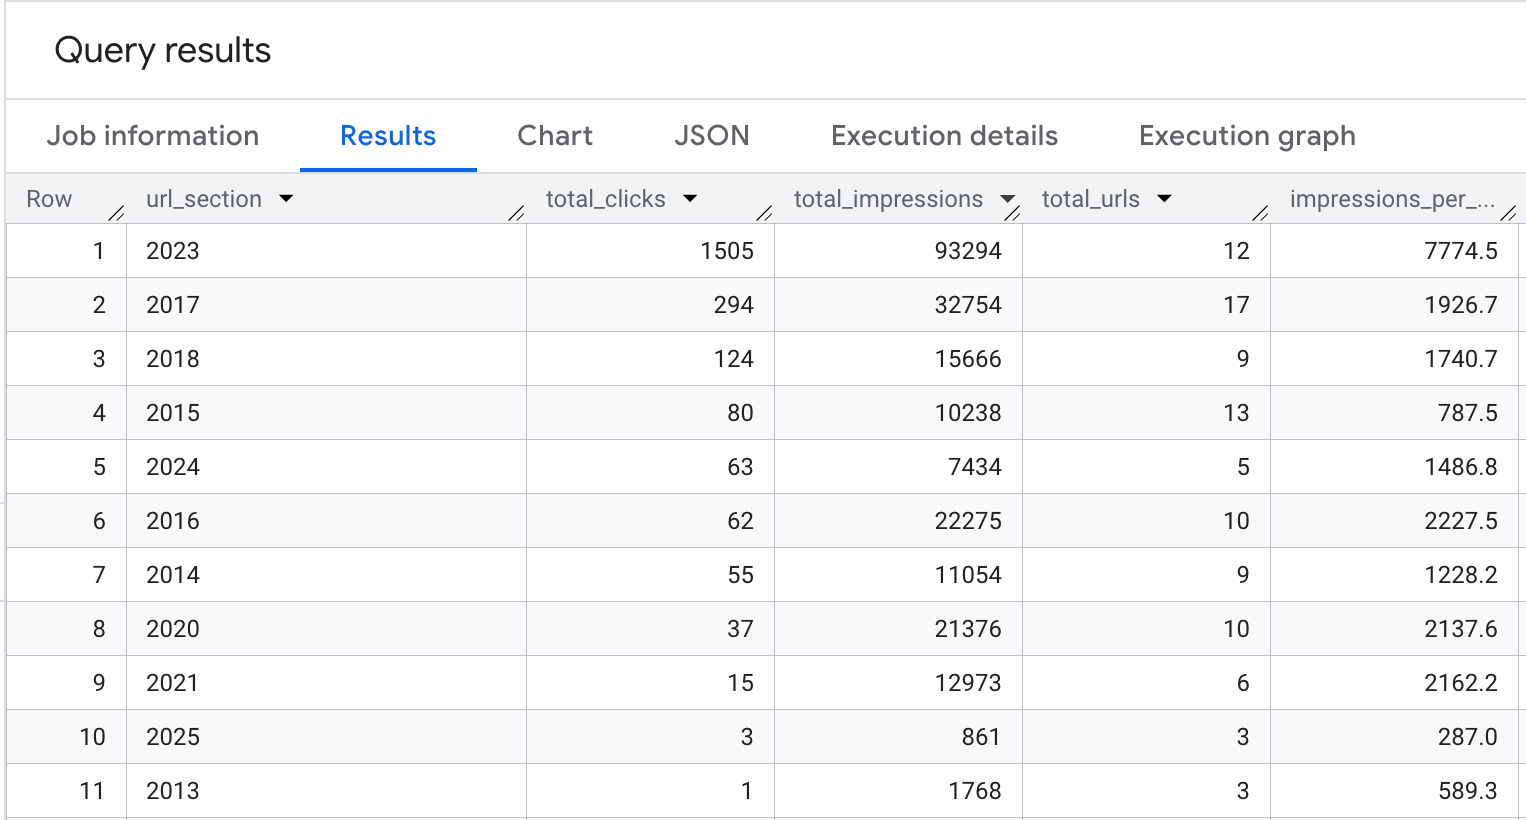
The results of this analysis will vary from site to site. Since my site’s blog URLs are organized by year, my results look like this. (I’ve excluded other directories for the purpose of demonstration.)

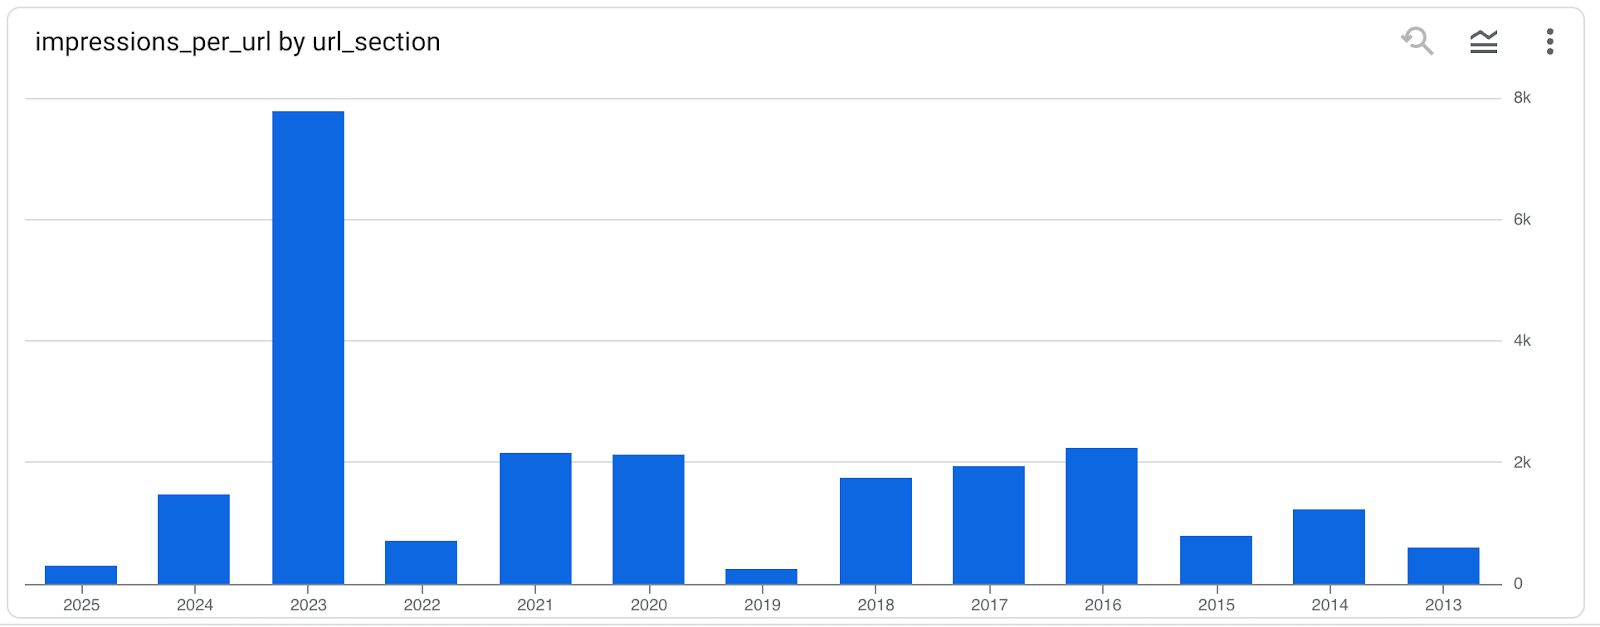
This data begs for a bar chart to visualize how productive my content was for SEO by year.

The fun thing about this kind of inductive analysis is that it provides a different perspective on on a site’s content that lead to unexpected insights.
But what if you already know how you want to segment your content? That’s next.
Customized segmentation using CASE Statements
If you already have an idea about how you want to categorize your site (a site map for example), then, a CASE statement is the perfect tool for assigning URLs to custom segments based on patterns in their paths.
This approach allows you to define meaningful groups—like blog, product, help, or landing pages—and analyze aggregate performance by category, rather than one URL at a time.
For example, you might want to roll up performance into categories like:
- Content Type: Blog, Product, Help, Other
- Topics: Baseball, Basketball, Football, etc.
- Funnel: Top, Middle, Bottom
By matching these sections with url LIKE conditions, you can tag each URL with a content group.
Here’s a query that assigns each URL to a category using a CASE statement and aggregates impressions and clicks accordingly:
WITH recent_date AS (
 SELECT MAX(data_date) AS max_date
 FROM `searchconsole.ExportLog`
 WHERE namespace = 'SEARCHDATA_URL_IMPRESSION'
)


SELECT
 CASE
   WHEN url LIKE '%/blog/%' THEN 'Blog'
   WHEN url LIKE '%/product/%' THEN 'Product'
   WHEN url LIKE '%/help/%' THEN 'Help'
   ELSE 'Other'
 END AS url_group,
 COUNT(DISTINCT url) AS total_urls,
 SUM(clicks) AS total_clicks,
 SUM(impressions) AS total_impressions,
 ROUND(SUM(impressions) / COUNT(DISTINCT url), 1) AS impressions_per_url
FROM
 `searchconsole.searchdata_url_impression`, recent_date
WHERE
 data_date BETWEEN DATE_SUB(max_date, INTERVAL 28 DAY) AND max_date
GROUP BY url_group
ORDER BY total_clicks DESC;
Segmenting with a CASE statement is especially useful when:
- You already know your content types or want to track specific sections
- You want more control than dynamic path parsing
- You’re comparing editorial vs. transactional pages, or different content strategies
Unlike GSC’s native UI—which limits you to one or two filters—this SQL-based approach allows you to analyze all content segments at once, and roll them up however you like.
Identify and addressing SEO issues
So far, we’ve focused on understanding what types of content perform best. But there’s just as much value in identifying what’s not working—or what shouldn’t be getting traffic at all.
In this section, we’ll explore how to find orphaned or unintended URLs in your search data—pages that might not belong in your public-facing index but are still appearing in search results.
These URLs often fall outside of your known content structure. They might be:
- Duplicate URLs with query parameters
- Test or staging environments accidentally indexed
- Old sections of the site that no longer serve a purpose
- The “Other” pages that don’t belong to one of your predefined site categories (like /blog/, /product/, or /help/)
To surface these URLs, we can filter for anything that doesn’t match expected patterns. This approach helps identify content that’s either accidentally indexed or exists outside of your intended information architecture.
Here’s a query that excludes known, valid content categories and surfaces any URLs outside those areas:
WITH recent_date AS (
 SELECT MAX(data_date) AS max_date
 FROM `searchconsole.ExportLog`
 WHERE namespace = 'SEARCHDATA_URL_IMPRESSION'
)


SELECT
 url,
 SUM(impressions) AS impressions,
 SUM(clicks) AS clicks
FROM `searchconsole.searchdata_url_impression`, recent_date
WHERE
 data_date BETWEEN DATE_SUB(max_date, INTERVAL 28 DAY) AND max_date
 AND NOT REGEXP_CONTAINS(url, r'^https?://(www\.)?yourdomain\.com/(blog|product|help)/')
GROUP BY url
ORDER BY impressions DESC;
This query helps surface URLs that fall outside your main content sections, making it a quick and effective way to identify anomalies in your indexed content. These might include thin or low-value pages, temporary URLs, duplicate content with tracking parameters, or legacy sections no longer meant to be indexed.
The key line in this query is this where clause filter that uses a regular expression to dictate what URLs should be excluded from the query results:
NOT REGEXP_CONTAINS(url, r'^https?://(www\.)?yourdomain\.com/(blog|product|help)/')
This condition filters out any URLs that start with /blog/, /product/, or /help/—the expected, valid content sections of your site. What’s left are URLs that don’t match your known structure, which may point to technical SEO issues or unintentional indexing.
For a more thorough approach, you can also join your GSC URL data against a sitemap or site crawl. This lets you identify URLs that are receiving impressions or clicks in search but aren’t present in your canonical list of site pages. These are your truly orphaned URLs—pages that may not be internally linked or included in your site architecture, yet still visible to Google.
This kind of analysis is ultimately about SEO quality control. It helps ensure that your search visibility is driven by the content you intend to rank, and that you’re not wasting crawl budget—or diluting your authority—on pages that shouldn’t be in search at all.
From Patterns to Action
This post , we’ve explored how to analyze URL-level performance using SQL and BigQuery—starting with broad distribution patterns, drilling into individual page contributions, and segmenting content by type, structure, and custom logic. These techniques allow you to move beyond GSC’s UI limitations and into flexible, scalable reporting that can reflect how your site is actually organized.
We looked at how to:
- Use ntile-based breakdowns to visualize traffic concentration
- Apply window functions to understand cumulative contribution from top-performing pages
- Segment content by path prefix or category to evaluate performance by section
- Identify unintended or orphaned pages that could be hurting your SEO efficiency
Each of these patterns supports a broader goal: connecting search performance back to the structure and intent of your content.
Whether you’re doing reporting or troubleshooting, these SQL templates can help you:
- Tailor analyses to your site’s unique URL structure
- Identify opportunities for consolidation or optimization
- Layer in additional data sources like sitemaps or crawl data for deeper diagnostics
Most importantly, these techniques can help bridge the gap between content strategy and SEO execution. By understanding how Google sees and surfaces your URLs, you can make more informed decisions about what to publish, what to update, and what to remove.
Use these queries as a starting point. Customize them for your own site. And revisit them regularly as your content—and the search landscape—evolves.

