A couple of weeks ago, while building out a scoring and segmentation model for a client, I arrived at a situation that Attio’s built-in reporting was not capable of handling. I explored a few options for analyzing prospect data (People and Companies) with varying degrees of success. I wrote this post to help you think about your options and potentially help you avoid exploring undesirable paths.
TL;DR: I wanted a simple, flexible, cloud-based way to analyze and segment CRM data from Attio. After exploring Google Sheets, BigQuery, and some DIY pipelines, I settled on Definite, a data platform that strikes a nice balance between control and flexibility, while handling all the mundane aspects of data management, allowing me to focus and quickly iterate on my analyses.
The situation
The business I’m working with finds itself in an enviable situation. Over the past six months, they’ve had extraordinary success building a waitlist for an impending product launch. This created the type of problem you want to have: more prospects than a small team could effectively engage. We needed to divide and conquer; segment the prospect base and assign each segment to a prospect that would maximize leverage within the constraints I mentioned..
If you’re familiar with Attio, you probably know that Attio has some basic reporting capabilities. They’re not bad (except that they knowingly included pie charts as an option), but they are built to report on performance, not thoroughly analyze the situation.
Attio’s built-in reporting capabilities are aligned with the product’s general direction, one that I would reduce to this prompt: What if using a CRM were as ergonomic as using Google Sheets? The CRM is in stark contrast to Salesforce or even Hubspot, which both require you to exhaust your creativity to customize your usage within their unforgiving steel walls.
Attio’s charting is limited in the same way Google Sheets is. You can look at one or two objects joined together at the same time and analyze them with up to two dimensions at a time.) I should admit that this limitation is as much a limitation of 2-dimensional screens, but I’ll avoid that tangent.) That said, the real limitation has more to do with data modeling and less with visualization.
Modeling Team Characteristics within Companies
In Attio, you can aggregate Company statistics by their constituent People’s attributes or People statistics by their parent Company’s attributes. The problem is, if you want to aggregate, for example, the count of a subset of people within a Company as a metric on that Company, you can’t (unless you want to create a new attribute, define and continually keep up-to-date that attribute with Workflow. Yeah… nah.
That was exactly the situation I found myself in.
I believed that our lead prioritization scheme should account for the number of viable buyers within an account—call it a bias for more “at-bats” within an account.
This requires aggregating a statistic about People for each Company. If you think in terms of SQL, this would require a subquery and a join, eg:
WITH viable_buyers AS (
    SELECT
        company_id,
        COUNT(*) AS viable_buyer_count
    FROM people
    WHERE persona IN ('Economic Buyer', 'Champion')
    GROUP BY company_id
)

SELECT
    c.id AS company_id,
    c.name,
    c.tier,
    vb.viable_buyer_count
FROM companies c
LEFT JOIN viable_buyers vb ON c.id = vb.company_id
So this is the situation I started from. Here’s how it went.
Exploring my options
I started my search with a few requirements in mind:
- It should be simple. My objective was pretty small in scope, so I didn’t want to waste lots of time and energy bike shedding.
- The data should automatically refresh. I had already exported data to create a GTM model, and ultimately, we’ll want to be able to report on all this.
- The end result should be cloud-based and shareable. Because ain’t nobody got time for spreadsheet attachments or dashboard screenshots.
- It should be inexpensive—ideally free. This is still in a kind of POC territory, so I wasn’t trying to spend a bunch of money, and if I did, I’d want the client to be comfortable with it.
Before I go on, I feel the need to explain myself. This isn’t my first rodeo in startup analytics. I’ve used Redshift, BigQuery, and Snowflake in production with dbt and Dataform. I’ve even offered a class on BigQuery. I ran growth at Panoply (a data warehouse as a service) and Census (OG reverse ETL), and I’ve spent more time in spreadsheets than I care to admit. My point is, I’m (probably) not crazy.
Let’s talk about my options.
Attempt #1: Google Sheets
Yeah, I started with Google Sheets. I figured there are enough apps to sync data into Google Sheets that I should be able to configure one for free. And as much as I hate the sound of it: VLOOKUPS and pivot tables would take me the rest of the way.
I’d used Mixed Analytics for syncing GSC to Google Sheets in the past. It was free and easy to set up, so I figured I could probably sync Attio with their custom connector for free too.
After a couple of hours trying to configure their custom API connection. I gave up on it. I looked at a few other syncing options, but they were all either more for operational use cases, or I didn’t love their pricing.
In hindsight, I probably should have tried Flatly and maybe others, but ultimately, all this started to feel stupid since I would have to use a VLOOKUP to join one sheet to a pivot table… No thanks.
Attempt #2: BigQuery
So I decided that if I was going to get into configurations, I might as well get something out of it that’s durable. It was time to shift to a relational database that, if nothing else, was certain to be able to handle my initial and eventual data wrangling problems.
For a moment, I considered Postgres.app, but that didn’t meet my cloud-based criteria. Then I considered Supabase. I’d been happy with Supabase in the past, and maybe I might rebuild a CRM do some interesting operational stuff with it too. Then I ate a snack, and with adequate blood sugar, I decided to choose a tool that was suited for the analytical job.
I’m familiar with BigQuery, it’s easy to spin up, and it was more than enough to solve this problem. For this workload, it would be free, and it met most of my other requirements. The only problem was that BigQuery is just the engine. I’d still need ETL and viz. That shouldn’t be a big deal, I thought.
There are numerous options for ETL. I’d stood up Airbyte in the past. It wasn’t so bad, and it would be free. This time, I decided to try the new cool kid on the block, dlt. The framework that brands itself as “lightweight Python code to move data” sounded promising. I should be able to manage that.
Here’s the summary of hours of ChatGPT conversations to get it up and running:
In this walkthrough, we set up a pipeline to sync data from Attio to BigQuery using dltHub. The process began with configuring Google Cloud IAM, where an enforced organization policy (iam.disableServiceAccountKeyCreation) initially blocked service account key generation. After elevating permissions to Organization Policy Administrator, we successfully removed the DENY rule and generated the required service account key. On the local development side, we encountered issues initializing the dlt project due to missing Git support on macOS, which was resolved by installing Xcode Command Line Tools and resetting the developer path using xcode-select. With these hurdles cleared, we were ready to initialize the pipeline with dlt init attio bigquery, completing the foundation for syncing CRM data into BigQuery with a fully scaffolded, Python-based ETL workflow. I finally said f— it, if it were simple, it wouldn’t have taken this long, and if this were any signal of the maintenance requirements, I decided I was barking up the wrong tree.
So it wasn’t BigQuery per se. It was the ingestion that nixed this option. And I’ll be honest, I probably could have gotten Fivetran or Airbyte up and running, but those felt so heavy for a POC that I decided to move on to another option.
Note: It is at this point that I’m expecting Redditors to have formulated their sassy takes.
Moving on…
After spreadsheets and data warehouses, the long tail of analytics tools is really long. My next area to explore was the data stack-in-a-box options, such as Panoply and Mozart. Both of those options essentially package the “modern data stack” that has become somewhat less modern in the last few years. I decided to try a fresh one called Definite.
Attempt #3: Definite, an all-in-one data platform
Definite promised to be an “all-in-one data platform,” a claim I was skeptical of since I had a pretty narrow objective, but I moved forward with it anyway.
I had met Mike Ritchie, the startup’s founder, back in 2020 after I had written an article called “8 New SQL Tools That Will Change How You Work in 2020.“ The piece included his previous startup, SeekWell (and looking back at the list, I’m pretty happy with how it held up!)
Mike has since founded Definite, and after speaking with him, I learned that the platform bundles the hottest open-source data infra (DuckDB and Iceberg) with Meltano for ingestion, and Cube for modeling. On top of that, it has a viz layer, and it promised to have AI woven through the whole stack.
This sounded promising, and with the potential to meet all the requirements (I even learned that they have a free plan for startups), it was definitely worth a try. I should also note that my experience with similar all-in-one platforms was ok at best, but I wasn’t about to go back to Google infra configurations…
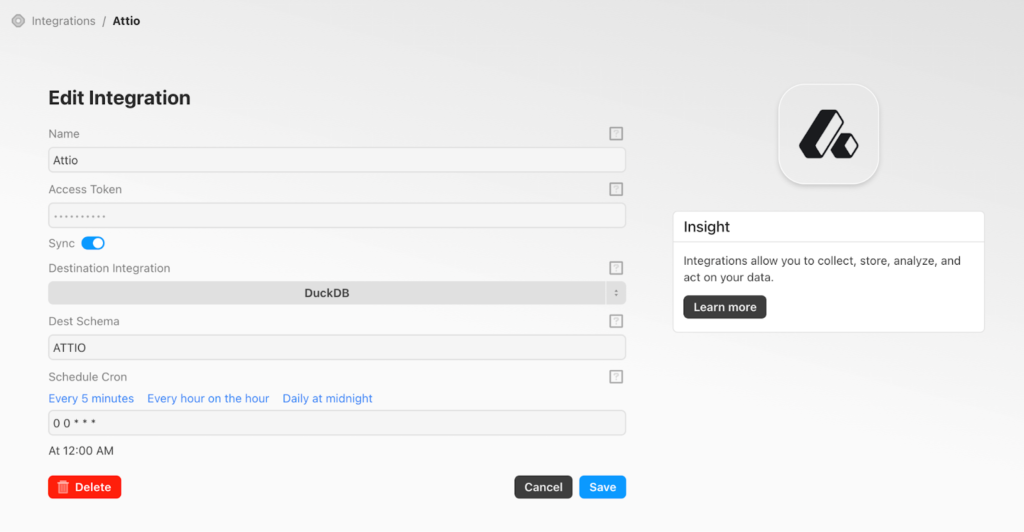
Syncing the Attio data was refreshingly easy. All I needed to do was enter my API key and say, “go.” My data was there within minutes.

The next step—navigating a whole new BI interface—was an interesting adventure.
The UX is geared more toward using the AI agent for most tasks. The thing about that is that it’s primarily reliant on the Cube semantic layer for context. I would say that the initial Cube model for Attio was solid, but the custom fields I planned to analyze were all missing.
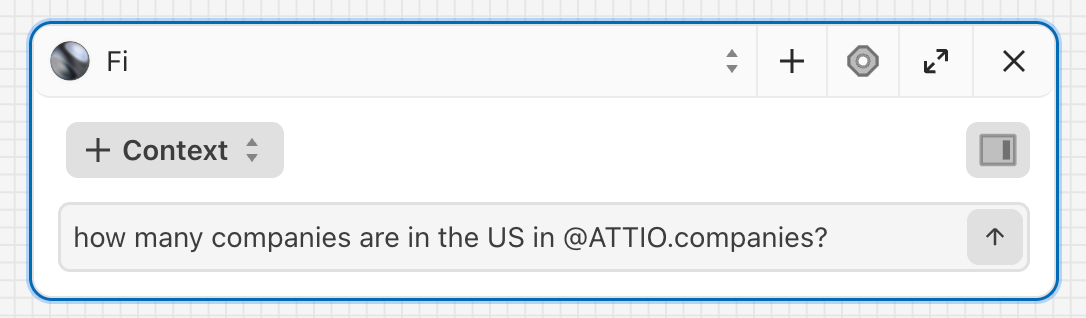
Instead of going to work on the Cube models, I decided to go directly to the DuckDB tables, which felt pretty familiar. I also learned that I could add tables to the agent’s context using the Cursor/Copilot @<schema.table_name> pattern, and that made the agent a lot more capable.
I quickly learned what I should offload to the agent and where I was better off writing the SQL myself. The agent is good at describing tables, simple queries, and analyses that don’t require sophisticated context. I’m sure it’s better when the semantic layer is all established, but for the sake of speed, I wrote the subqueries I needed.
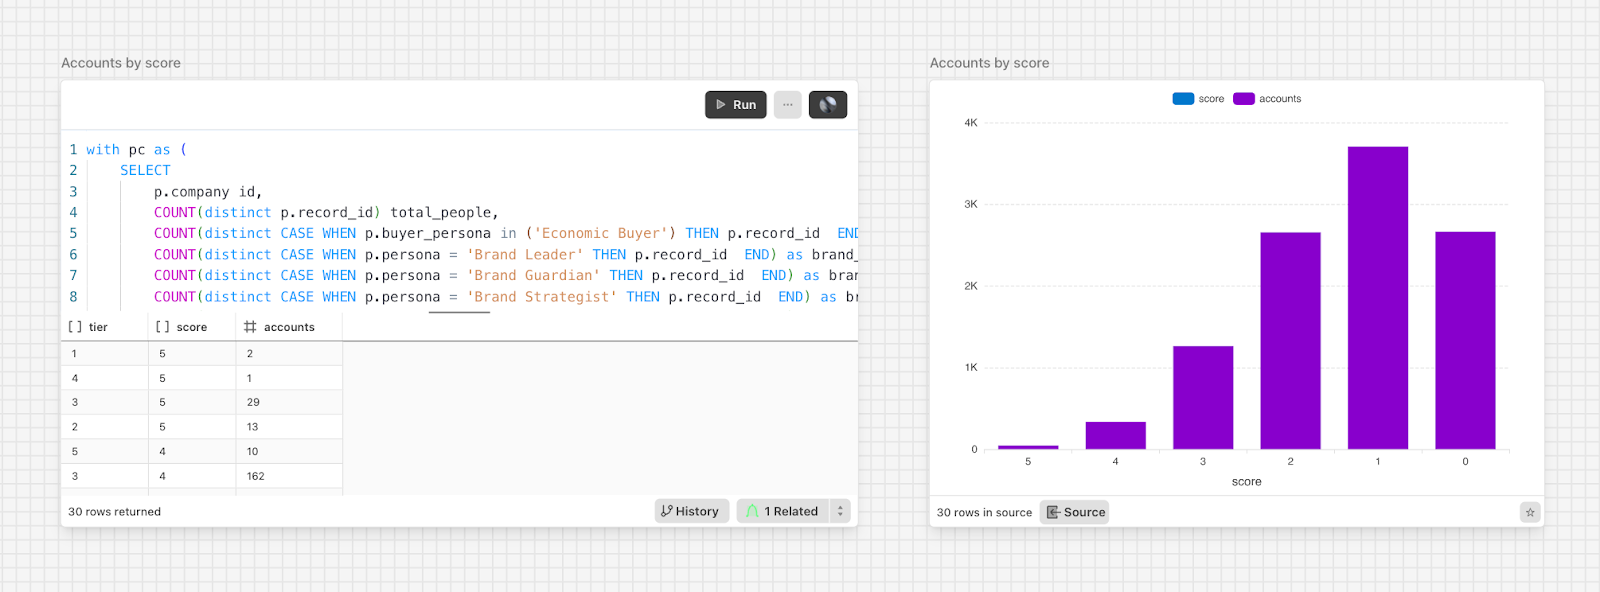
Building visualizations in Definite follows an intuitive pattern—once you get it. Analysis occurs on a canvas, similar to Count (and has subsequently been copied by BigQuery). This is a big plus for reusability, because you can point multiple charts and pivot tables at a single query. That made iteration easy.
What’s wild is that you can pull in any canvas asset into context and even turn on a “YOLO” mode, which allows the agent to edit the semantic layer, so you could point the agent at a query and tell it to update the Cube model accordingly. 🤯
Anyway, outside of familiarizing myself with the tool, performing the analysis was as easy as you’d expect. I wrote the subquery and began analyzing my initial scoring model within an hour. That has since raised several more questions, and I’ve been off to the races since.
Winner: Definite
As I mentioned in the TL;DR, I appreciate the balance that Definite strikes between ease of use and configurability. In the end, it felt way more durable than any spreadsheet-based solution and way less complex than an enterprise-grade data warehouse setup. The semantic layer, canvas layout, and AI assistant seemed promising as an analytical process built for speed, that actually scales.
If I were looking back at this again, I wish I had skipped the spreadsheet option altogether. And, being honest, I probably should have used a packaged ETL option for simplicity, but I’m glad I got to where I’m now and feel pretty confident running with it.
Let me know if you have any questions in the comments about my process or decisions. Also, feel free to reach out directly. Til’ next time ✌️