
“A spreadsheet is just data in single-player mode”
Last week I made a mistake. I boldly claimed that “A spreadsheet is just data in single-player mode.” And while I stand by that claim. I didn’t expect to be called to account for it.
As it turns out, the post was pretty popular and I think I know why. To me it boils down to five factors.
- The scale and application of data still growing (duh)
- There aren’t enough people with the skills to work with data at scale
- There are plenty of resources to learn SQL but the path to using it in the “real world” isn’t very clear
- The tools have caught up and basically, anybody with spreadsheet skills can set up a data stack that works at scale
- Now is a great time to upskill and become more effective in almost any career take advantage of the demand
The hard part? You have to pull yourself away from spreadsheets for a while—go slow to go fast (and big).
You’ll thank yourself in the end. Being able to think about data at scale will change how you approach your work and being able to work at scale will increase your efficiency and impact. On top of that, it’s just more fun!
A Minimum Viable Data Stack
In the spirit of a true MVP, This first step is going to get you from spreadsheet to SQL and with the least amount of overhead and a base level of utility.
In the next hour you will:
- Stand up an analytical database
- Write a SQL query to replace a pivot table
- Have basic tooling and process for a repeatable analytical workflow
In the next hour you will not (yet):
- Run anything on a cloud server (or be able to share reports beyond your computer)
- Setup any continually updating data syncs for “live” reporting
But don’t underestimate this. Once you start to work with data in this way, you’ll recognize that the process is a lot less error-prone and repeatable than spreadsheet work because the code is simpler and it’s easier to retrace your steps.
Starting up a Postgres database
Postgres isn’t the first thing that people think of for massive-scale data warehousing, but it works pretty well for analytics—especially at this scale, it is definitely the easiest way to get started and of course, it’s free. Ultimately, you’ll be working with BigQuery, Snowflake, and if this were 2016, Redshift.
I apologize in advance but this tutorial will be for a Mac. It won’t really matter once everything moves to the cloud, but I don’t own a Windows machine…
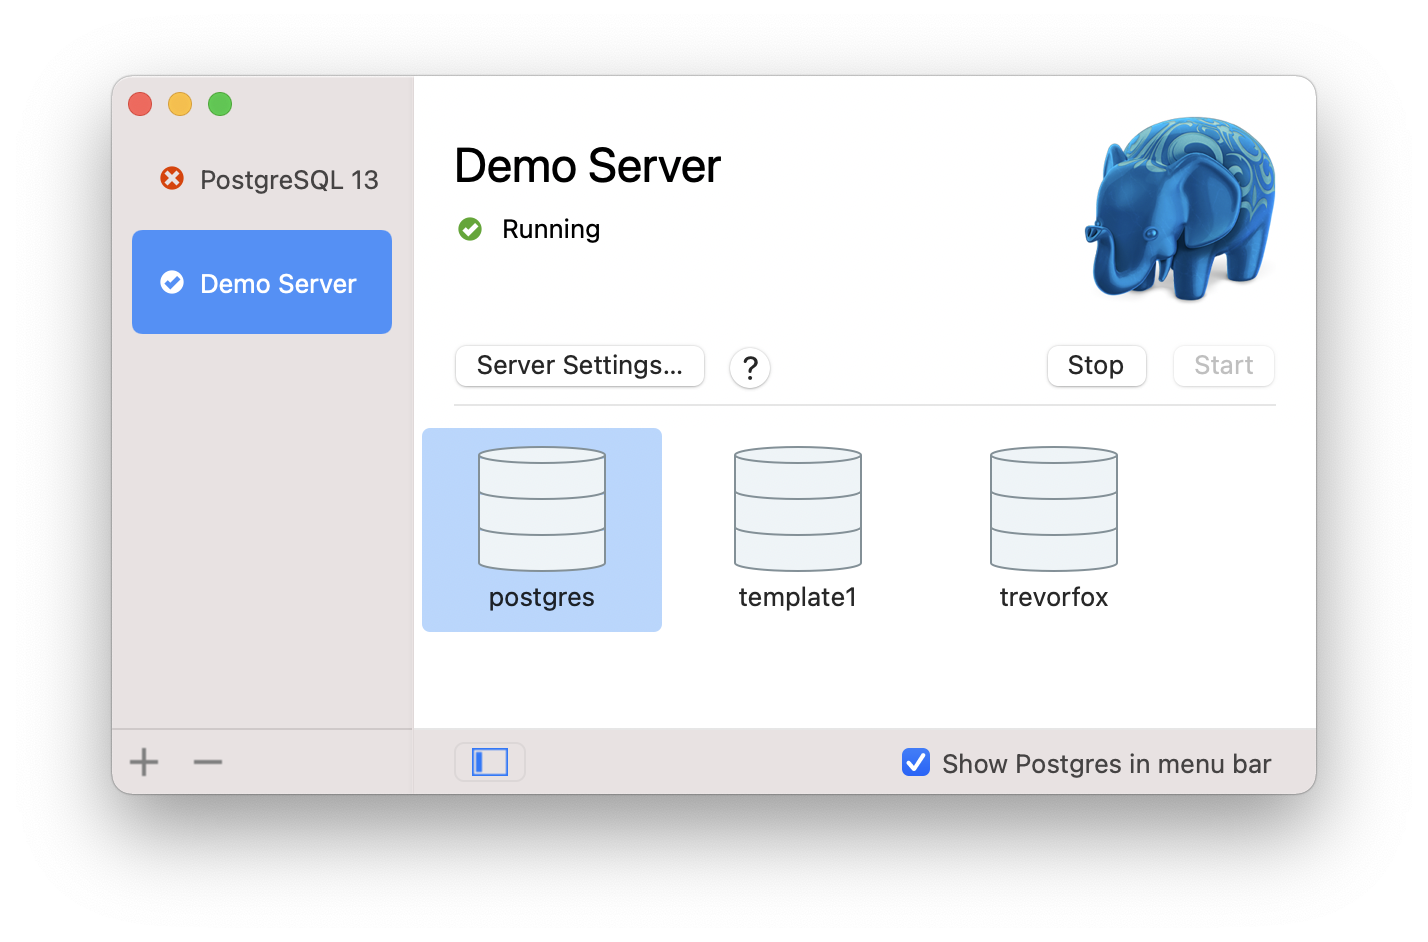
The easiest way to get a Postgres server running on a Mac is Postgres.app. It wraps everything in a shiny Mac UI and the download experience is no different than something like Spotify.
- Step 1: Head over to https://postgresapp.com/downloads.html and download the app
- Step 2: Move the app to the Applications folder and then open it by double-clicking on the icon
Congrats! You have installed a Postgres server on your local machine and it’s up and running!
Here are some instructions for installing Postgres on Windows. And here’s a list of Postgres clients for Windows that you’d use instead of Postico.
Now let’s see how quickly we get connected to the database.
Connecting to Postgres
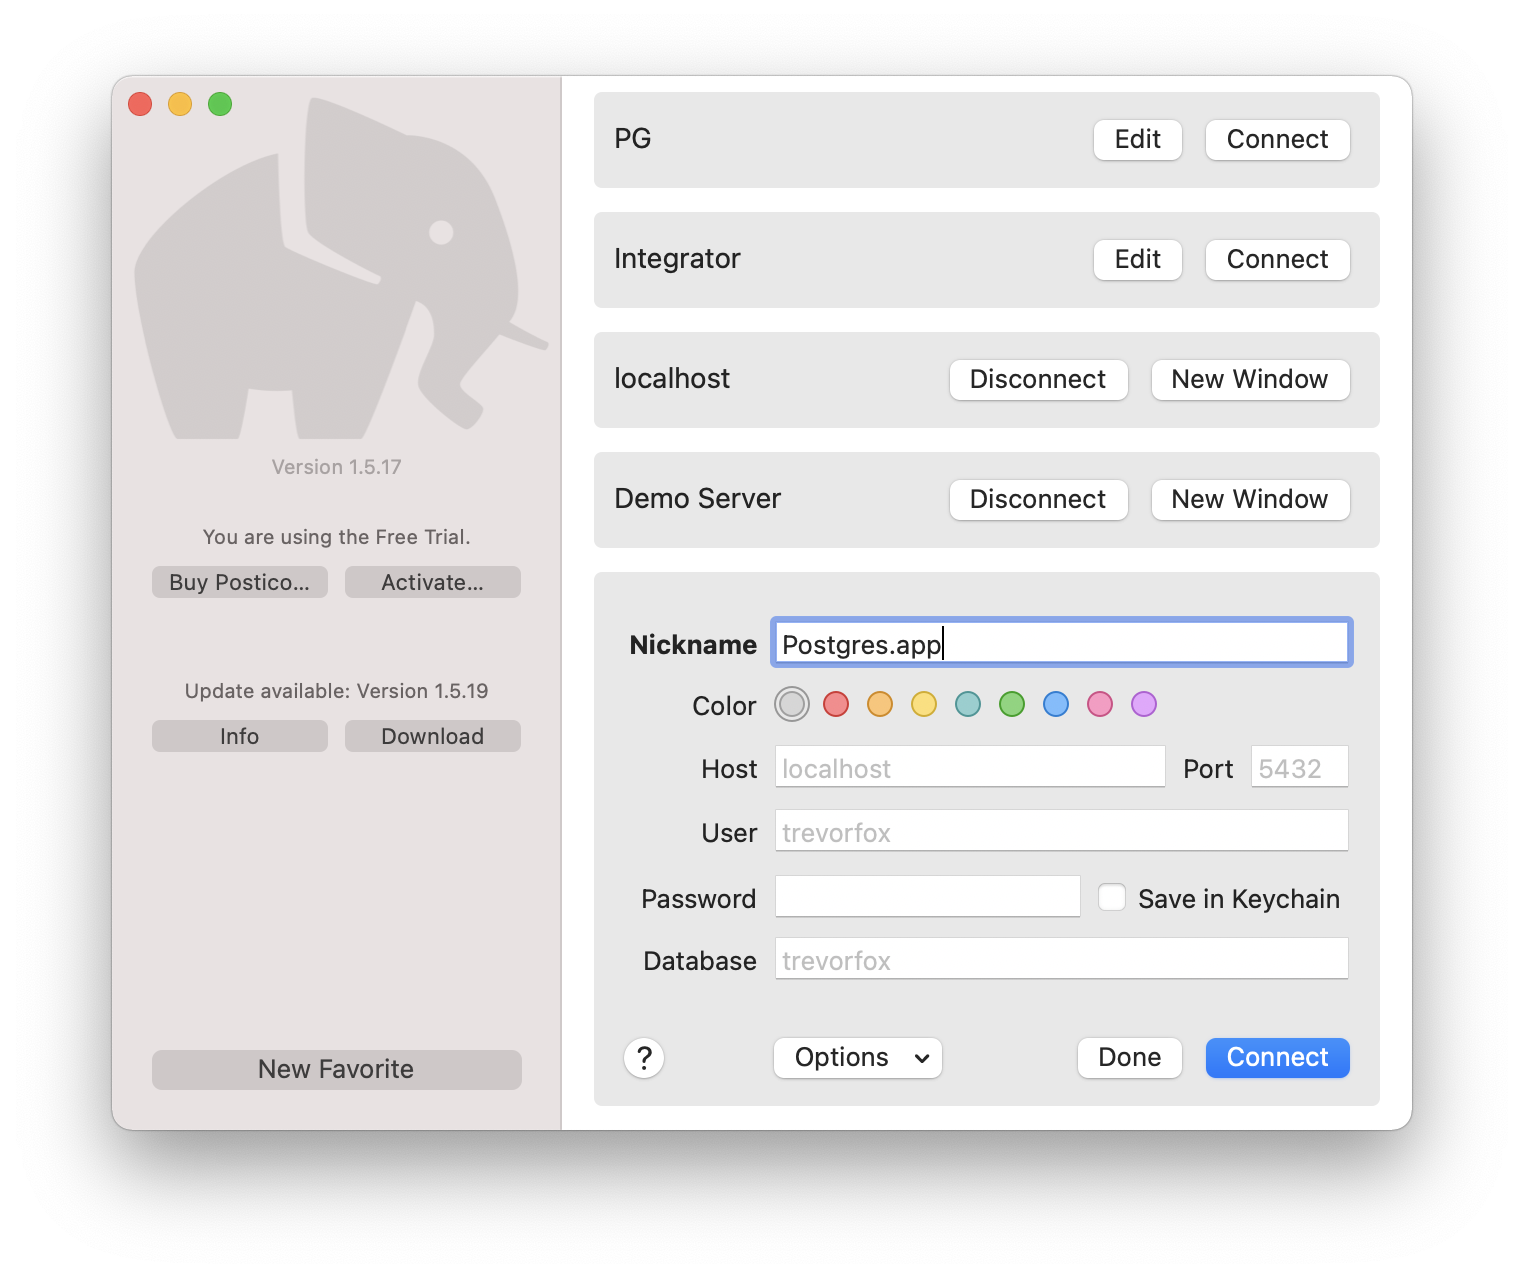
There are plenty of good SQL editors for Postgres but since we are keeping this MVP, I’m going to recommend Postico. Again, it has a simple Mac UI and is designed for more of an analytical workflow than hardcore database management.
- Step 1: Head over to https://eggerapps.at/postico/ and download the app
- Step 2: Move the app to the Applications folder and then open it by double-clicking on the icon
- Step 3: Create a database connection by clicking on the “New Favorite” button. Leave all fields blank; the default values are suitable for connecting to Postgres.app. Optionally provide a nickname, eg. “Postgres.app”. Click “Connect”
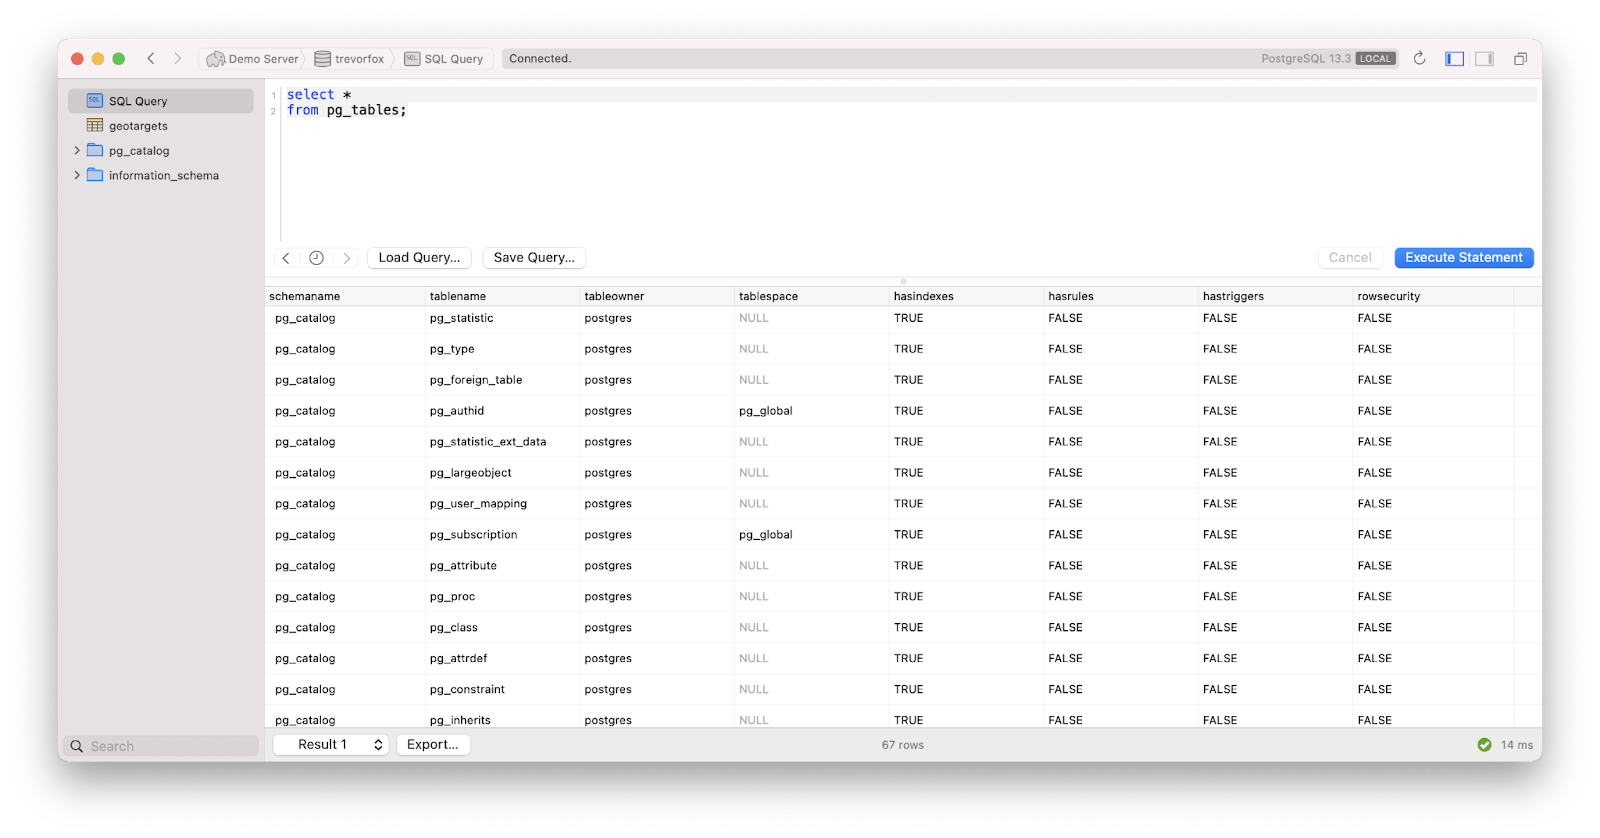
- Step 4: Go back to Postico and choose the SQL Query icon
- Step 5: Test your connection by running a query.
Run the query “select * from pg_tables;” to see a list of all the tables in your Postgres database. Since you haven’t loaded any tables, you’ll just see a list of Postgres system tables that start with the prefix, “pg_.” As you probably guessed, the “pg” stands for Postgres.
You’ve done it! You’ve started up a Postgres database, connected to it, and run your first query!
Loading data into Postgres
Ok, the boring stuff is out of the way and it’s only been about 15 minutes! Now we can get to the actual analysis. Next, let’s load some actual data into Postgres.
Loading tables in Postgres is a little bit different (aka more involved) than loading a CSV into Google Sheets or Excel. You have to tell the database exactly how each table should be structured and then what data should be added to each table.
You might not yet know how to run CREATE TABLE commands but that’s ok. There are tools out there that will shortcut that process for us too.
The imaginatively named, convertcsv.com generates the SQL commands to populate tables based on a CSV file’s contents. There are lots of ways to populate data into a database but again, this is an MVP.
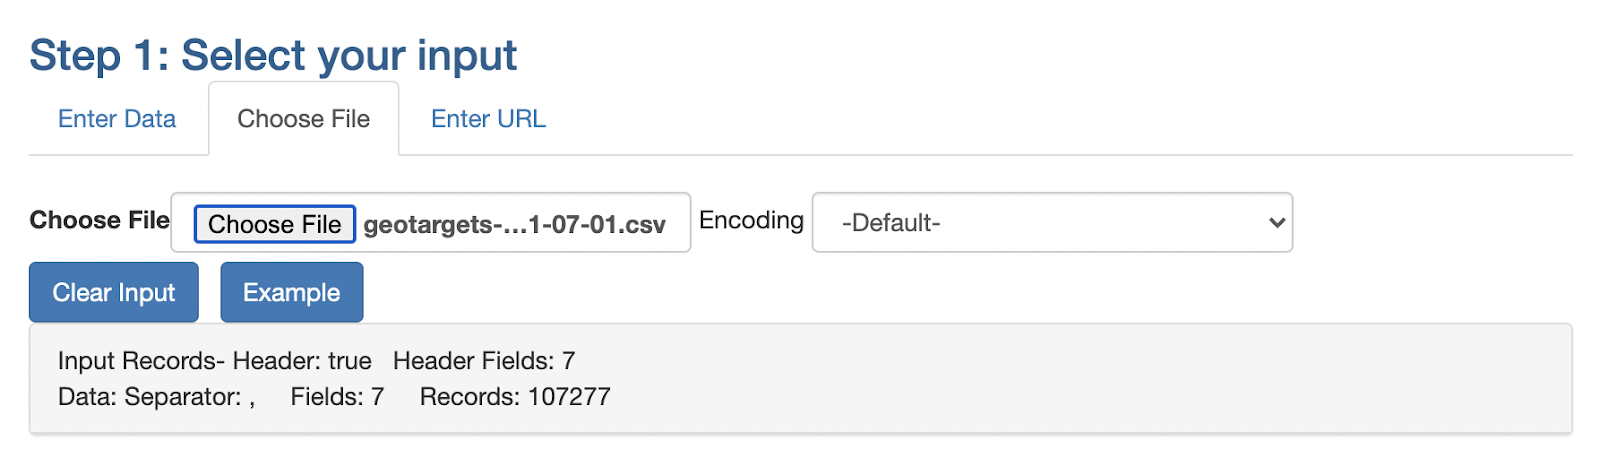
For this tutorial, I’m using the Google Analytics Geo Targets CSV list found here. Why? Because the file is big enough that it would probably run pretty slowly in a spreadsheet tool.
- Step 1: Head over to https://www.convertcsv.com/csv-to-sql.htm
- Step 2: Select the “Choose File” tab to upload a CSV file.
- Step 3: Change the table name in the Output Options section where it says “Schema.Table or View Name:” to “geotargets”
- Step 4: Scroll down to the Generate Output section and click the “CSV to SQL Insert” button to update the output, then copy the SQL commands
- Step 5: Go back to Postico and click on the SQL Query icon
- Step 6: Paste the SQL commands into the SQL window
- Step 7: Highlight the entirety of the SQL commands and click “Execute Statement”
You’ve loaded data into your database! Now you can run super fast analyses on this data.
Analyze your data!
You’ve already run some commands in the SQL window in the previous step. The good news is it’s always just as simple as that. Now analysis is basically just the repetition of writing a command into the SQL editor and viewing the results.
Here’s a simple analytical query that would be the equivalent of creating a pivot table that counts the number of rows within each group. Paste this in to find the results.
select g.country_code, count(criteria_id) count_id
from geotargets g
group by g.country_code
order by count_id desc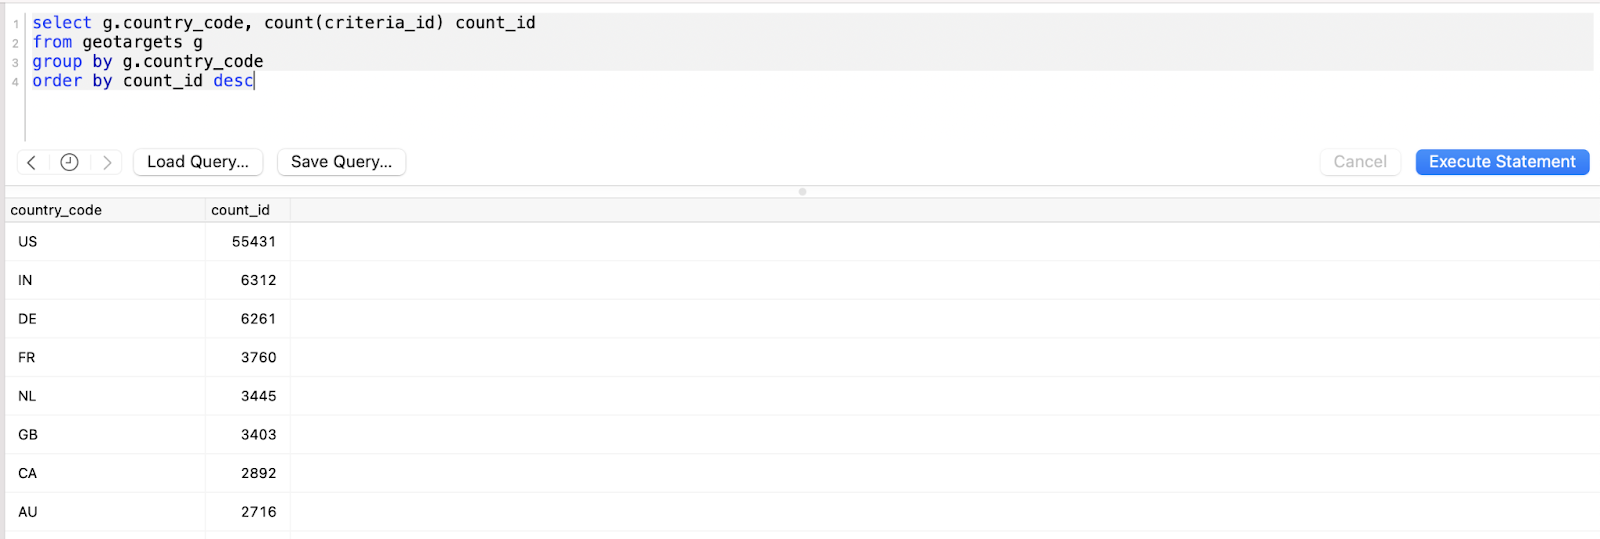
You’ve done it! You’ve replaced a spreadsheet with SQL!
But this is not the end. PRACTICE, PRACTICE, PRACTICE! Analysis in SQL needs to become as comfortable as sorting, filtering, and pivoting in a spreadsheet.

Looking forward
If you’re thinking to yourself, “this still feels like single-player mode…” you’re right. This is like the first level of a game where you play in single-player mode so you can learn how to play the game and avoid getting destroyed in a multiplayer scenario.
In fact, you probably wouldn’t do this type of analysis in a database unless you were going to pull in CSV files with millions of rows or if you were to pull in a bunch of other spreadsheets and join them all together. In those cases, you’d see significant performance improvements over an actual spreadsheet program.
The real utility of a database for analysis comes when you have data dynamically being imported from an ETL tool or custom code. On top of that, running a database (or data warehouse) on the cloud makes it possible for you and your team to access the data and reports in real-time instead of just doing analysis locally and sending it to someone else as a CSV or other type of report document. Hopefully, I don’t need to tell you why that is a bad process!
If I stay motivated… The next step will be to dynamically import data into the new Postgres database with an ETL tool called Airbyte which also runs on your computer. At that point, the scale and complexity of the analysis will really increase.
After that, as long as I keep at it… the next step would be to set up a BigQuery instance on Google Cloud. At that point, you can combine a cloud-based business intelligence tool with Airbyte and BigQuery and start to get a taste of what a functioning modern data stack looks like.
I hope this was a helpful start for you. Let me know in the comments if you get hung up.
Follow on LinkedIn
Pingback: SEO Analytics in SQL for Beginners: A step-by-step tutorial • Trevor Fox