You may have heard the hype about integrating Google Search Console and Google BigQuery using the new Bulk Export feature. If you’re like me, you recognize the power of analyzing SEO data with SQL or the BI tool of your choice (you’ve probably heard of Looker and Looker Studio).
Or you might be thinking to yourself, “So what? I have a spreadsheet program that works just fine.”
If you want to understand what GSC+BQ means for SEO analytics, keep reading—I will tell you. If you just want to get into the details of using BigQuery with Google Search Console, skip ahead.
What is Google BigQuery, and what is it for?
You may have heard of Google BigQuery as it’s grown in popularity over the last 10+ years. If you work in SEO, you probably know that Google has, for several years, been promoting the native integration between Google Analytics and BigQuery, so you probably understand that it’s a tool for analytics.
BigQuery is technically a cloud data warehouse, and you can think of a data warehouse as a database purpose-built for storing and efficiently analyzing LOTS of data.
To put BigQuery’s scale in perspective, let’s consider my laptop, which has a hard drive that can store up to 500GB of data. BigQuery, on the other hand, can work with petabytes of data, and ONE petabyte is 2 MILLION times the storage size on my laptop. And a petabyte is 50 MILLION times as much data as you can store in a Google Sheet.
Besides having massive storage capacity, a cloud data warehouse is mainly used to store data from many different sources, from marketing and advertising to human resources, to purchasing and anything else a business might want to analyze.
A relevant SEO use case would be aggregating all your GSC, GA, and Shopify shop data to analyze what keywords you should target to increase sales.
Finally, cloud data warehouses are powerful because they are… in the cloud. Being in the cloud means that anybody with permission to connect to the data warehouse can access it from anywhere with an internet connection.
This isn’t the first time anybody has analyzed GSC data in BigQuery, but it’s much easier now. Before this integration, you would have to either build an ETL (extract, transform, load) pipeline or use a vendor like Fivetran or Airbyte. Needless to say, moving this much data from the Google Search Console API has its challenges. Trust me, I know.

Getting started with Google Search Console and BigQuery
Ok, you’re ready to jump aboard the data warehouse train. What’s next?
Setting up the Google Search Console BigQuery integration is remarkably simple. Just follow these five steps:
- Set up your Google accounts: You’ll need two accounts: a Google Search Console account (you must be a property owner) and a Google Cloud Platform (GCP) project. “Google Cloud projects form the basis for creating, enabling, and using all Google Cloud services (including BigQuery), enabling billing, adding and removing collaborators, and managing permissions for Google Cloud resources.” You can create a new project here.
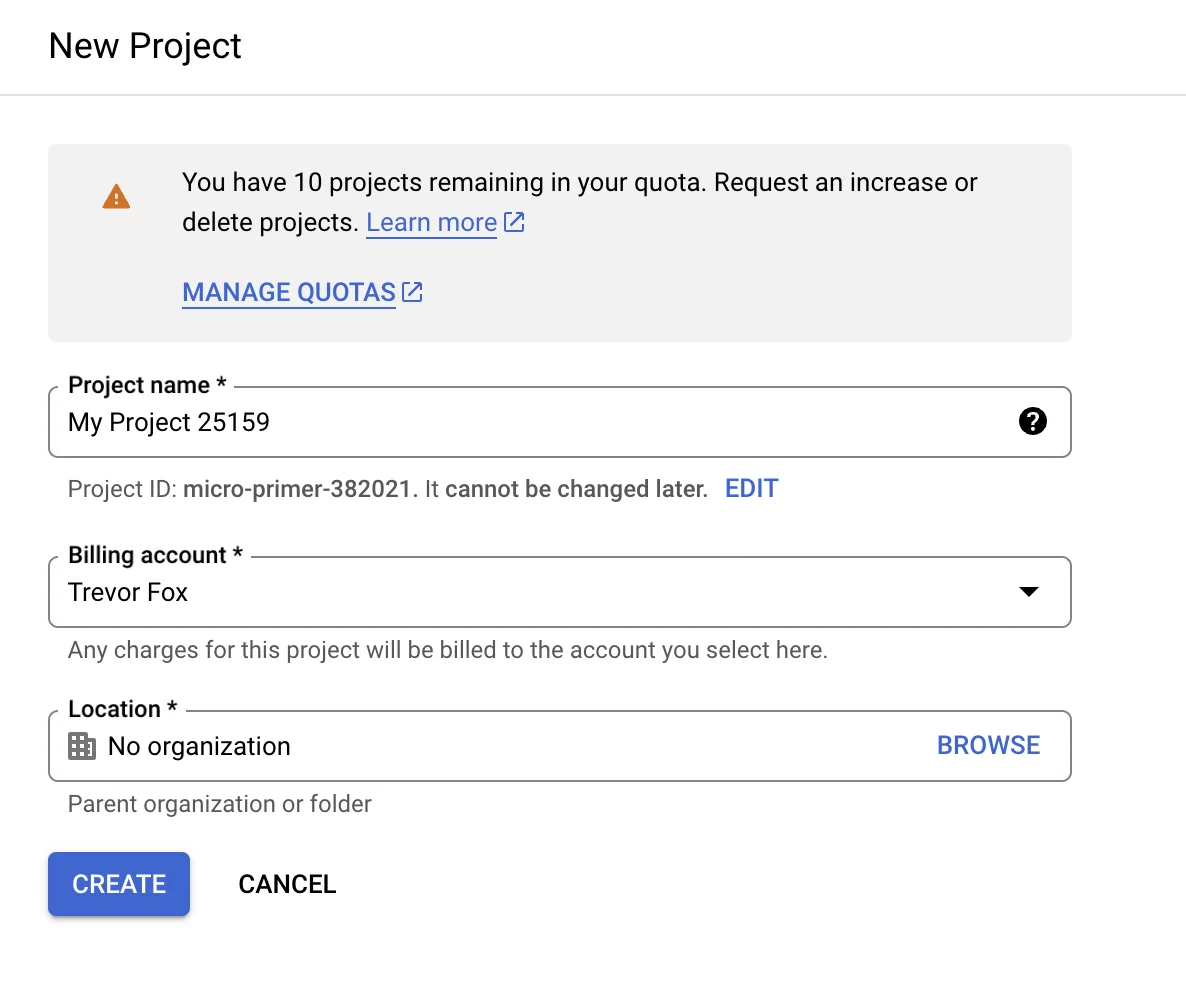
*Note that you will also need to set up billing for your project. Did you think they would give this away for free?! - Enable BigQuery: Now that you have your project up and running to manage access and billing, you can enable BigQuery. This link will take you directly to the BigQuery setup flow.
You now have your own BigQuery instance!
Don’t worry. You won’t pay anything initially, but if you keep loading in data and start to query it, your bill will add up gradually over time. - Set up your BigQuery permissions: I’m taking this directly from Google’s documentation:
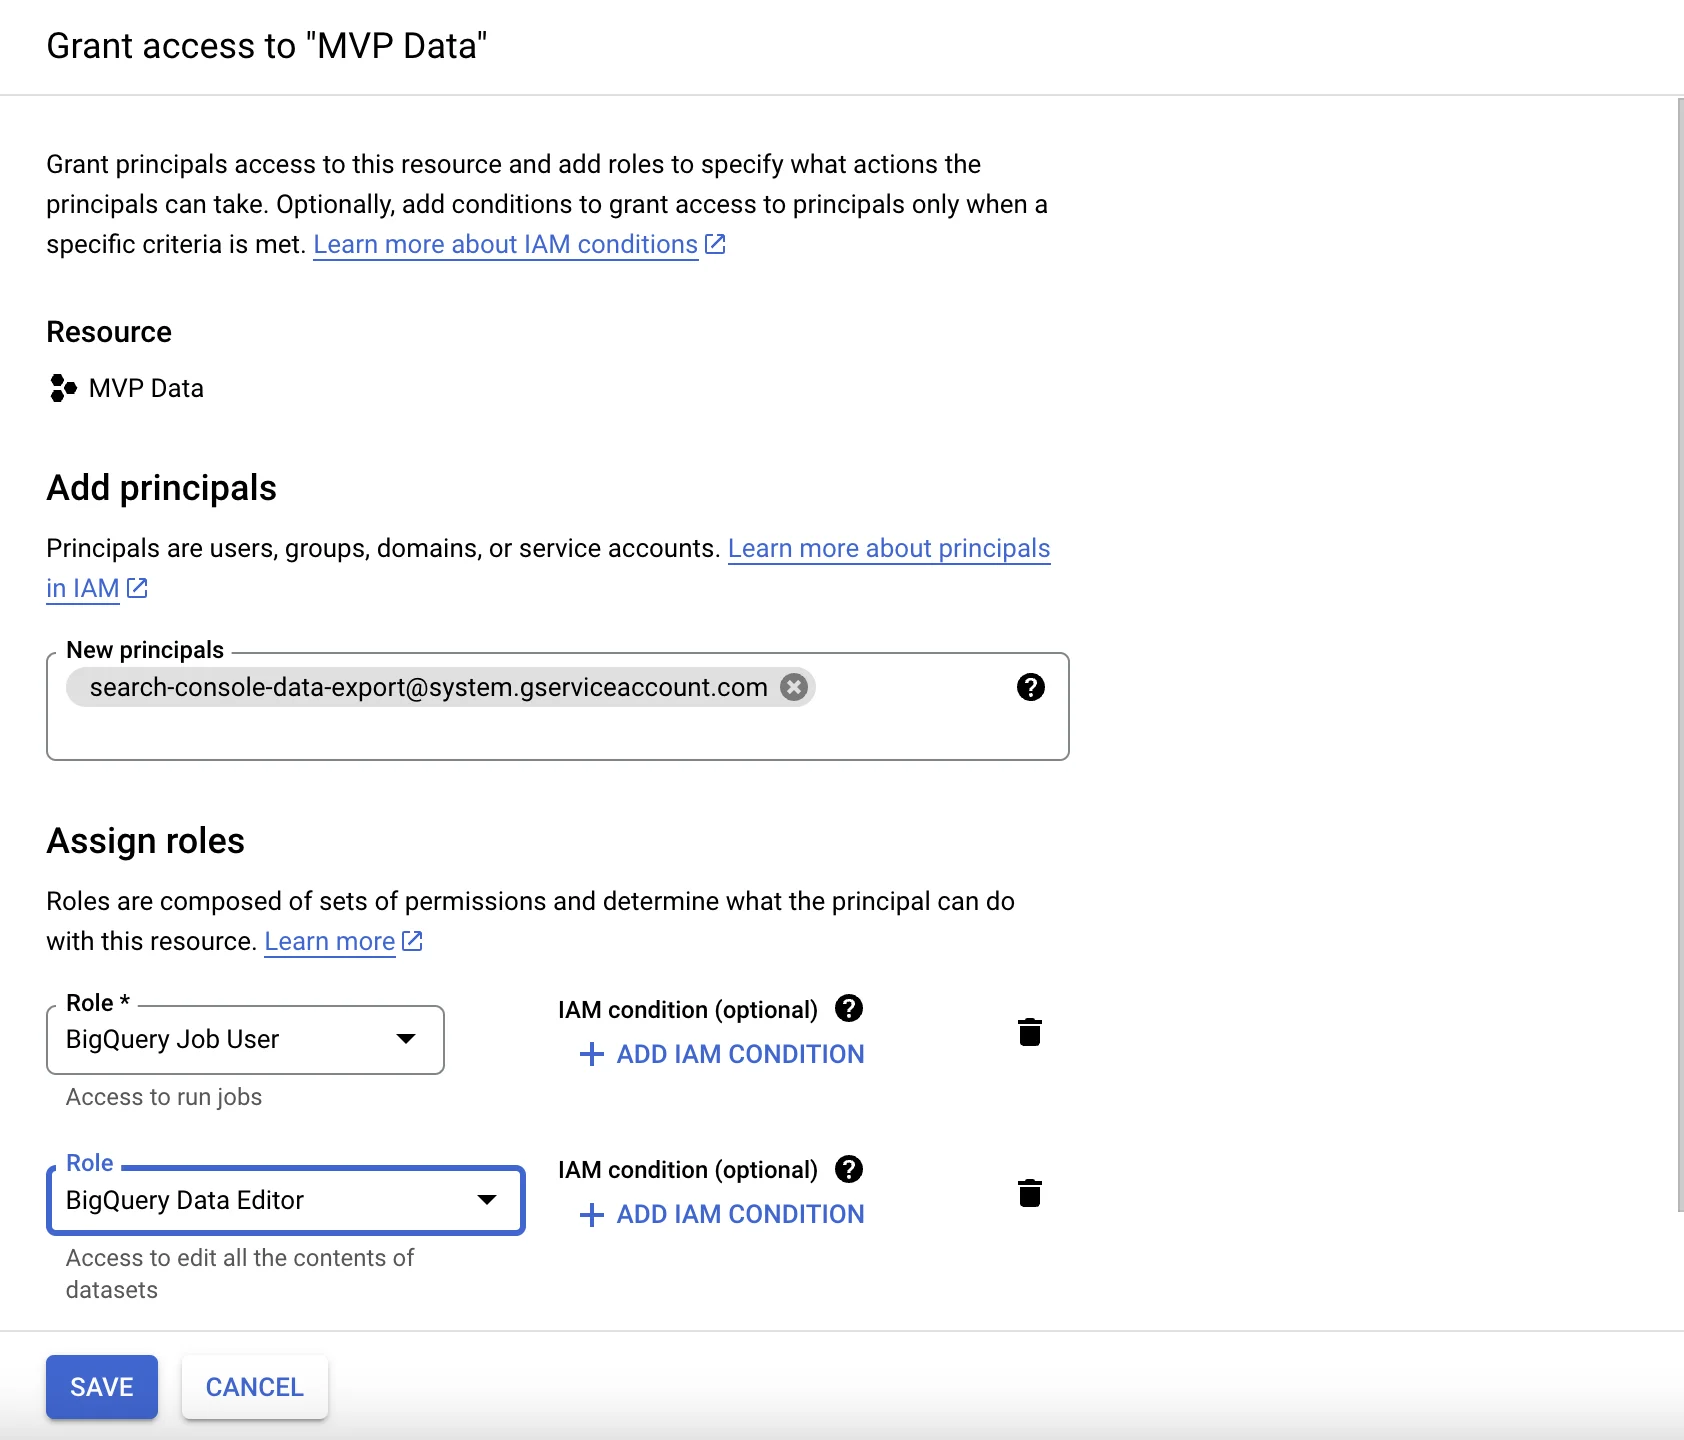
Grant permission to Search Console to dump data to your project:- Navigate in the sidebar to IAM and Admin. The page should say Permissions for project <your_project>.
- Click + GRANT ACCESS to open a side panel that says Add principals.
- In New Principals, paste the following service account name: search-console-data-export@system.gserviceaccount.com
- Grant it two roles: BigQuery Job User (bigquery.jobUser in the command-line interface) and BigQuery Data Editor (bigquery.dataEditor in the command-line interface).
- Click Save.
- Setup Google Search Console (almost done!): Luckily, this is the easiest part. Just head over to the bulk export settings page in Google Search Console and enter the project ID that corresponds to the GCP account that you set up in Step 1. Also, enter the storage region that fits your data privacy and storage price demands. (This is only really significant if you’re setting this up for production.)
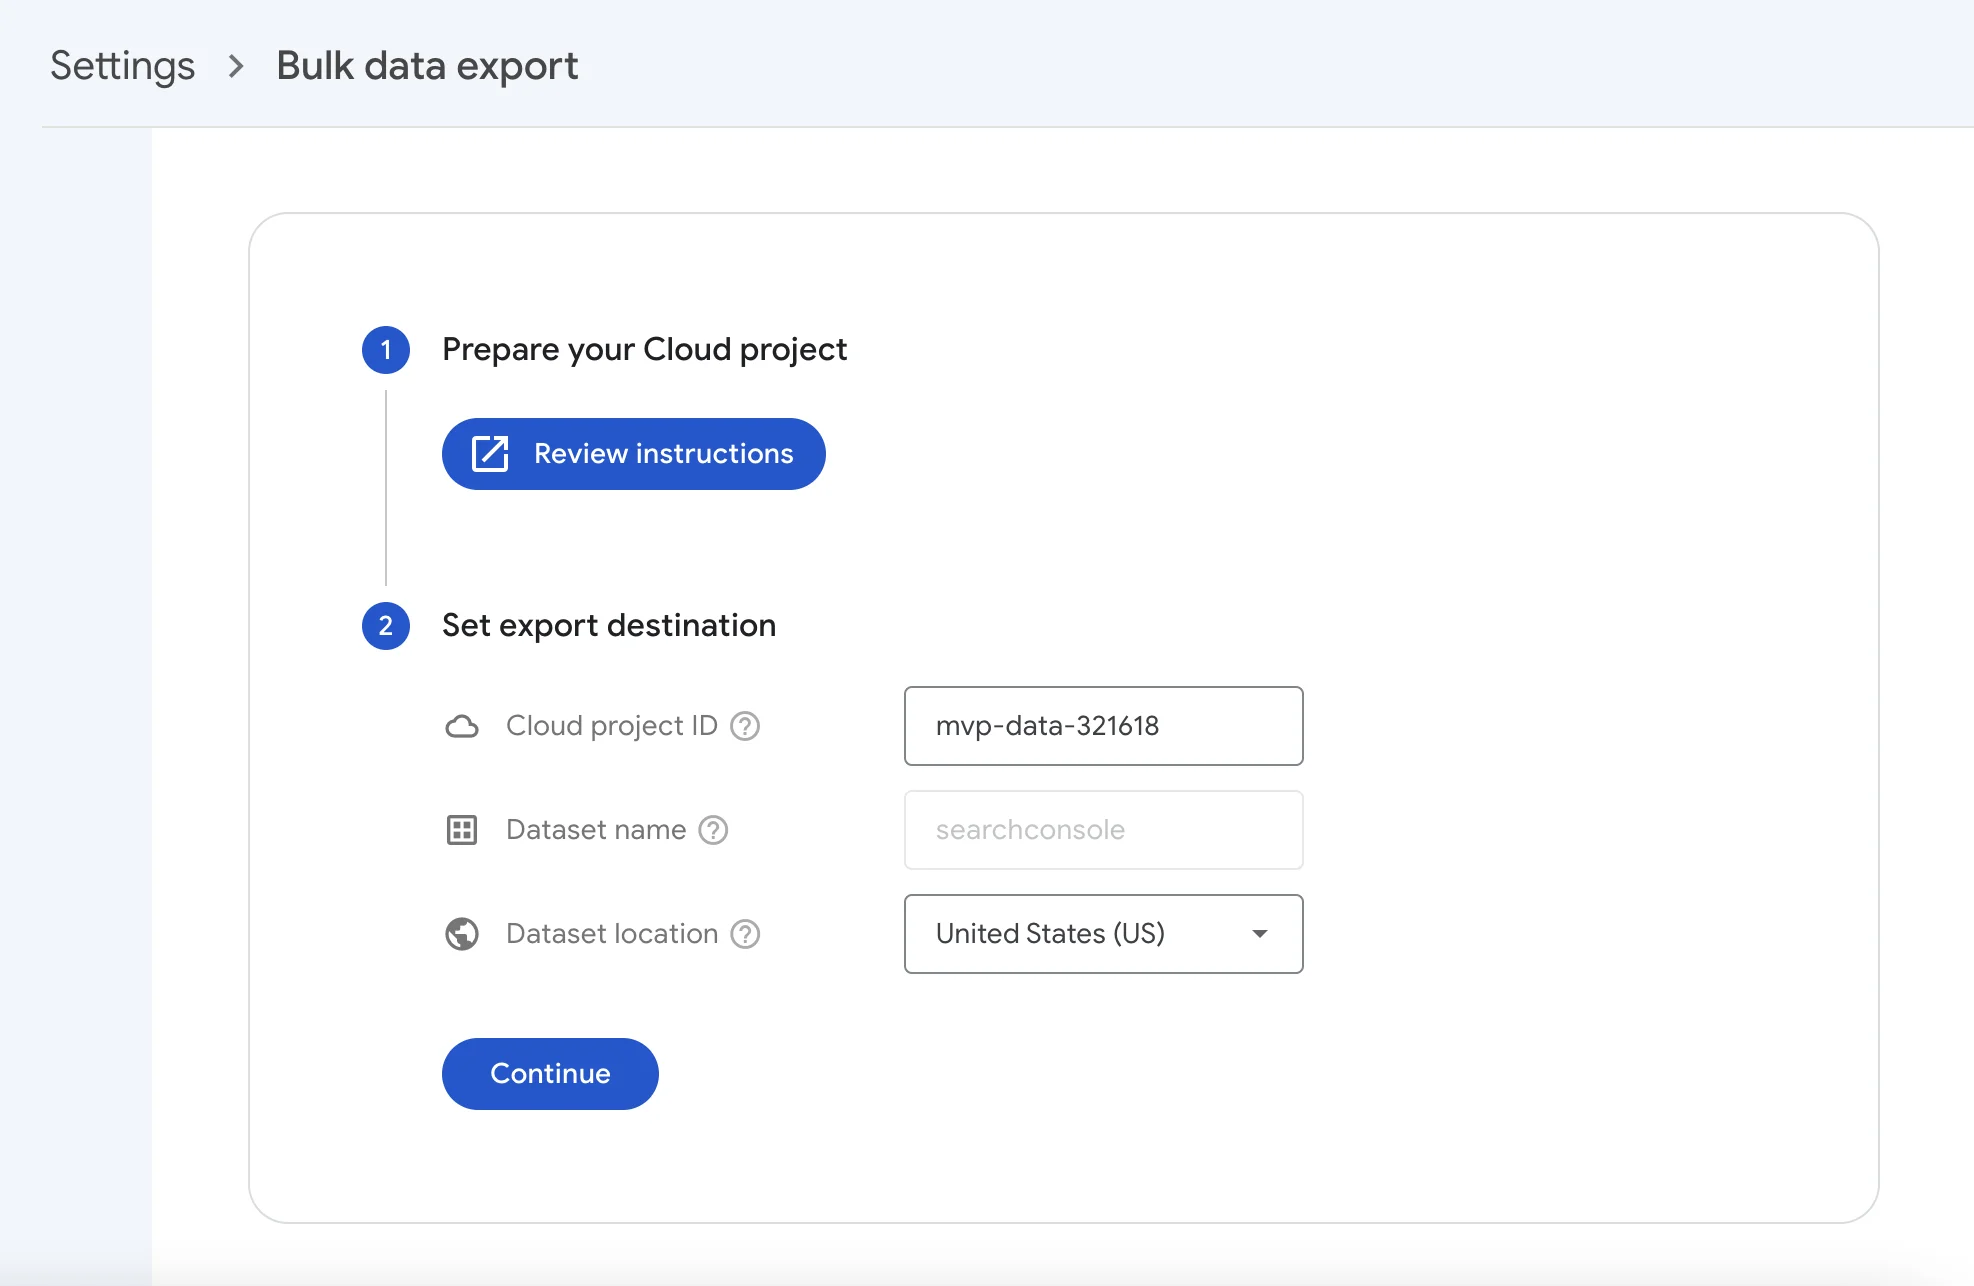
You can find your project id on your GCP project settings page. Make sure that you select the right GCP project, and in the project selector dropdown, then the project ID is displayed at the top of the page.
- Success! If I’ve done my job correctly and you’ve followed these steps, you should see a screen that looks like this.
Bear in mind that your first export will happen up to 48 hours after your successful configuration in Search Console, and it will load data from the previous day (not historical data.)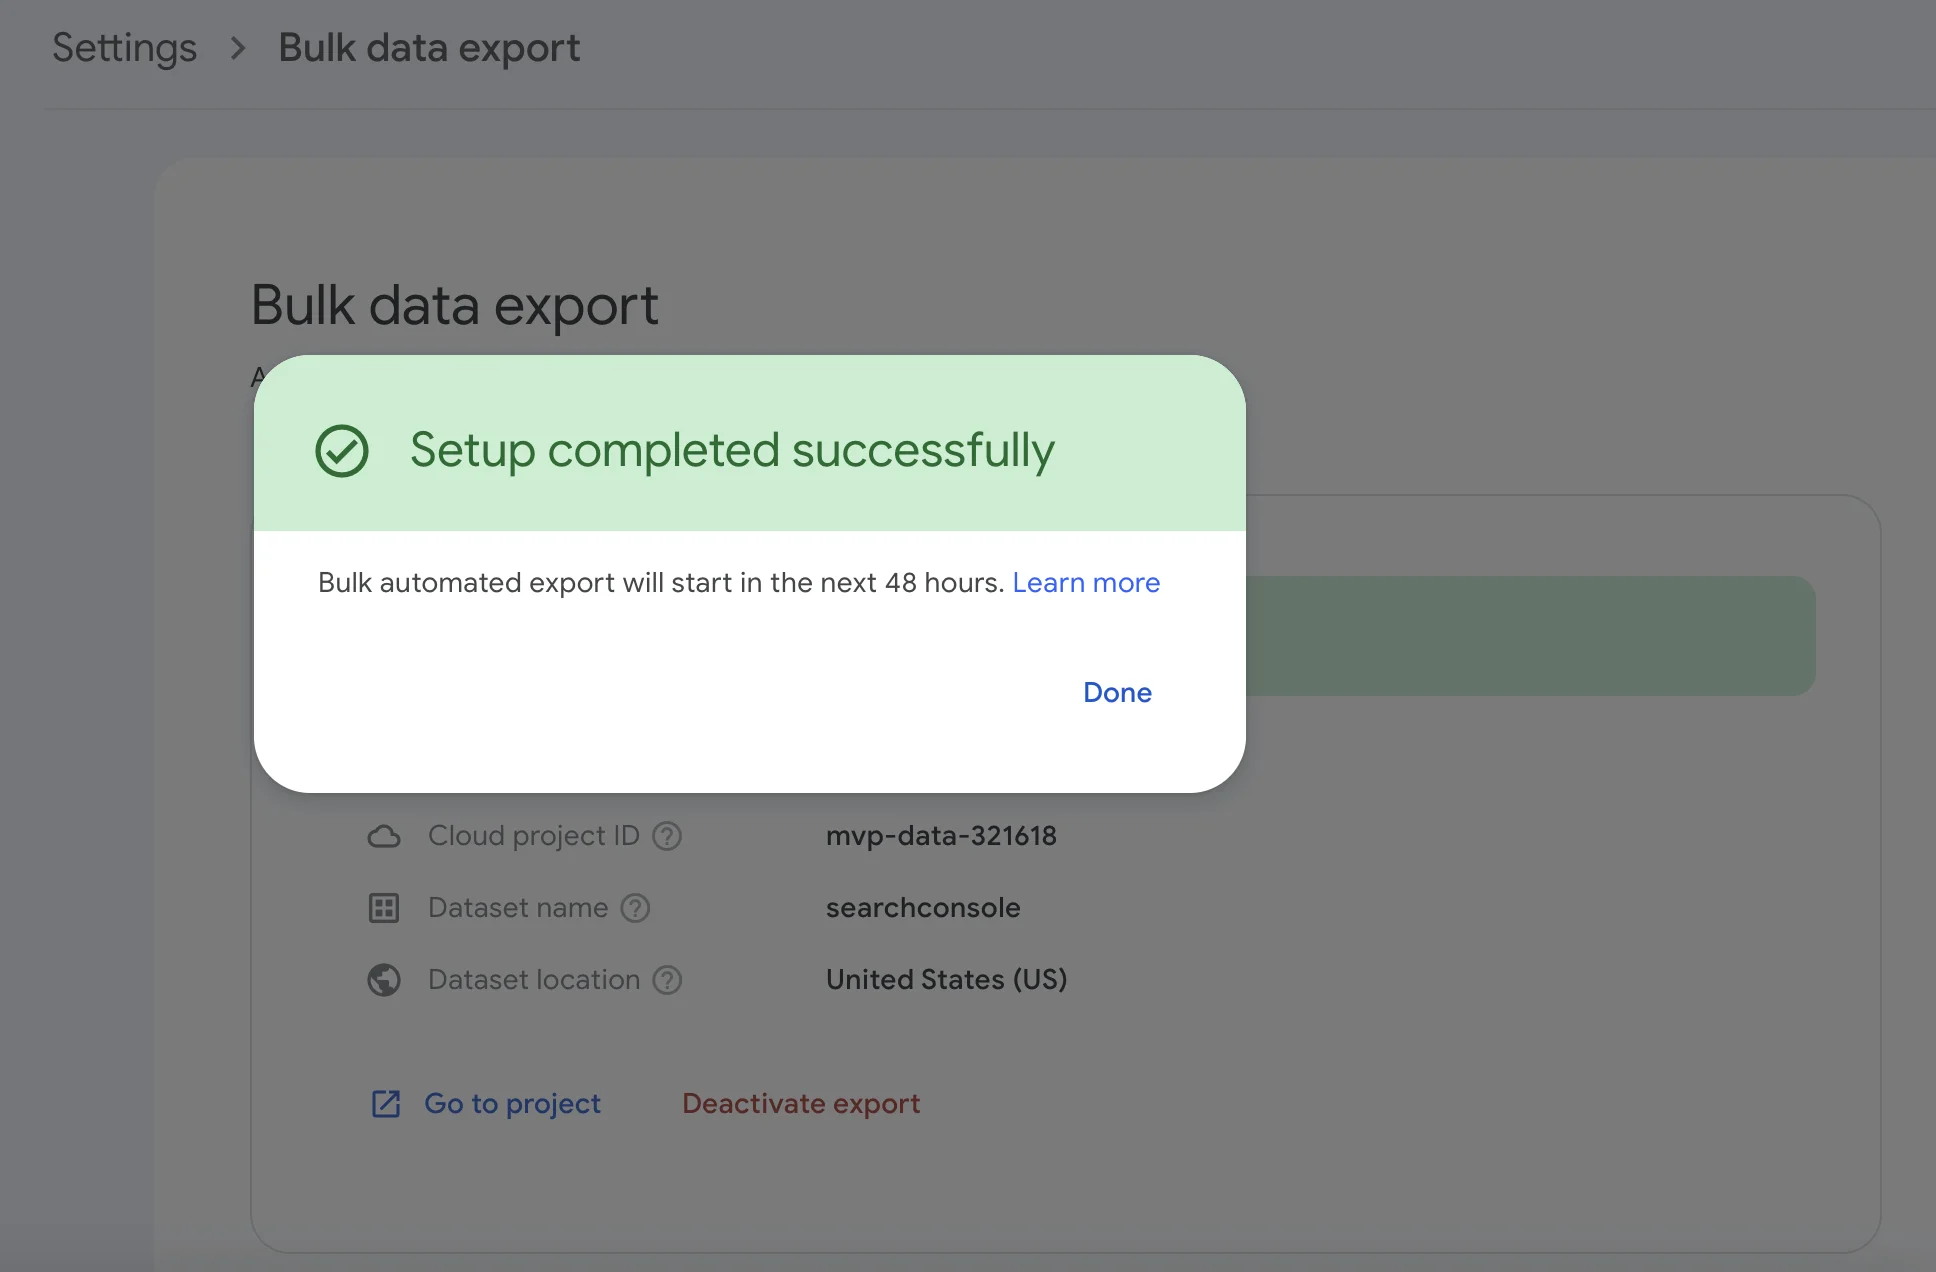
Estimating your pricing (and how much you get for free)
Guess what. This integration isn’t totally free. After all, why would Google be giving it away?
Google BigQuery pricing works similarly to Google One pricing (storage for Drive, Gmail, etc.) Google offers a hefty amount for free, then charges you for additional storage units beyond their free tier. The only difference is that BigQuery pricing also adds on the dimension of what they call “analysis,” which is basically billing for the cost of processing data in analytical workloads (i.e., querying and other data operations.)
Don’t worry, though. BigQuery’s free tier is pretty generous. You can store up to 10GB of data and query up to 10TB of data for free every month.
Now I’m not going to get into all the detail about the different designations for data and use (you can read about pricing here), but to put this in context, my site, which gets around 30k impressions per week, loads about 5MB of data into BigQuery per week.
Don’t take my word for it, but at that rate, unless I grow my site or I query the data like crazy, I’ll stay under the free tier for the next five years.
💡 The volume of data that is more a factor of keyword variety than it is search volume. A site with a low search volume for lots of keywords will generate more data than a site with lots of search volume for a single keyword.
This is all to say, keep an eye on your storage and use. You can see how much data is stored in each table by clicking on the table in the resource viewer (on the left) and viewing the table’s “DETAILS” tab. Then you can compare that to costs with their pricing calculator.

* Note that you can stop the export at any time from the Google Search Console bulk export settings page.
There is one more thing to note about costs — specifically limiting costs. You can reduce the amount of data that is loaded into BigQuery by specifying the data retention time. See this snippet from the Search Central blog.
Tables are retained forever, by default, as are partitions, subject to any global defaults set by your Google Cloud project or organization.
If you want to avoid accruing data indefinitely, we recommend putting an expiration on the partition after an acceptable period of time: a month, six months, twelve months, or whatever is reasonable for your needs and the amount of data that you accrue. Putting an expiration date on the entire table is probably not what you want, as it will delete all your data.
Get to know thte data
The integration produces three tables in BigQuery under the schema named “searchconsole” (unless you specied a name affix in initial setup.)
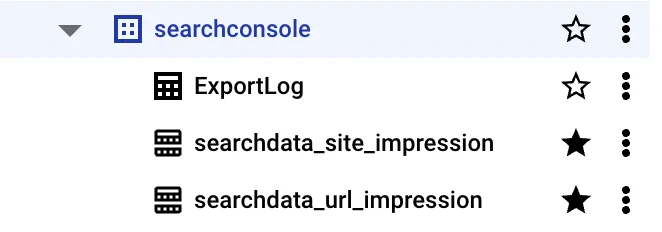
Two of the tables, searchdata_url_impression and searchdata_site_impression contain data about Google Search Console’s performance reports, and the third is a log table named ExportLog that “contains information about each successful export to one of the previous data tables.” Want to get into detail about the tables? Check out my post all about the Google Search Console tables.
Bulk Export limitations
While we’re deep in these weeds, let’s talk about limitations. Two limitations immediately come to mind: 1) anonymized queries and 2) lack of control over how the data is organized.
Anonymized queries
Anonymized queries are Google search queries that Google deems to have the potential to identify the searcher due to the nature or uniqueness of the query. If you’ve used Google Search Console, you’re probably familiar with this limitation, so it’s not such a big deal.
The nice thing about how the bulk export handles anonymized queries (compared to other ETL vendors who access data from the API) is that it writes rows that aggregate all the metrics for all the anonymized queries per site/URL per day instead of just omitting them the rows.
These anonymized rows are helpful because you get complete sums of impressions and clicks when you aggregate the data—not just sums of impressions and clicks for data where the search query is known.
That said, while anonymized queries are a limitation, this integration handles them pretty well. The next limitation is more significant.
💡 One thing to be mindful of is the difference in anonymized query volume between the searchdata_url_impression table and the searchdata_site_impression table. Like the GSC interface, some queries for particular URLs in particular countries might be so infrequent that they could potentially identify the searcher. As a result, you’ll see a greater portion of anonymized queries in your searchdata_url_impression table than in your searchdata_site_impression table.
Schema control and configuration
If you only operate or want to analyze one site, Bulk Export is plenty. But if you wanted to analyze the search data from two or more different Google Search Console accounts together, well, at this point, you’re out of luck. Google made the integration easy to set up and manage, but that all comes at the expense of configuration.
The issue is that you can only associate one GSC account with one GCP project. And the dataset name has to be “searchconsole.” (This is not longer true! See the update above.)
If you built your own integration or you used an off-the-shelf ETL tool to extract your GCP data, you could land data from multiple accounts into the same project, into the same schema, and the same tables. That way, you could compare how several owned sites rank against a keyword on a given day.
As far as I can tell, it’s impossible to analyze data from two or more different GSC accounts together with the bulk export integration.
Tips and Tricks for SQL Analysis
Now that we’ve gotten through all the nitty gritty details, let’s take a look at what you can do with the Google Search Console data. I’m only including a few simple queries here because 1) many of the queries I described in my SEO analytics in SQL post will apply here, and 2) the possibilities are nearly endless, so, at best, I can only inspire you to try things.
Let’s start with the basics and then get a little more interesting.
Using multiple filters at the same time
This is one thing that bugs me about Google Search Console. Unlike Google Analytics, where you can apply multiple filters on multiple dimensions, GSC only allows you to apply one filter per dimension. If you have a big site with lots of content and different hierarchies, this can be very limiting.
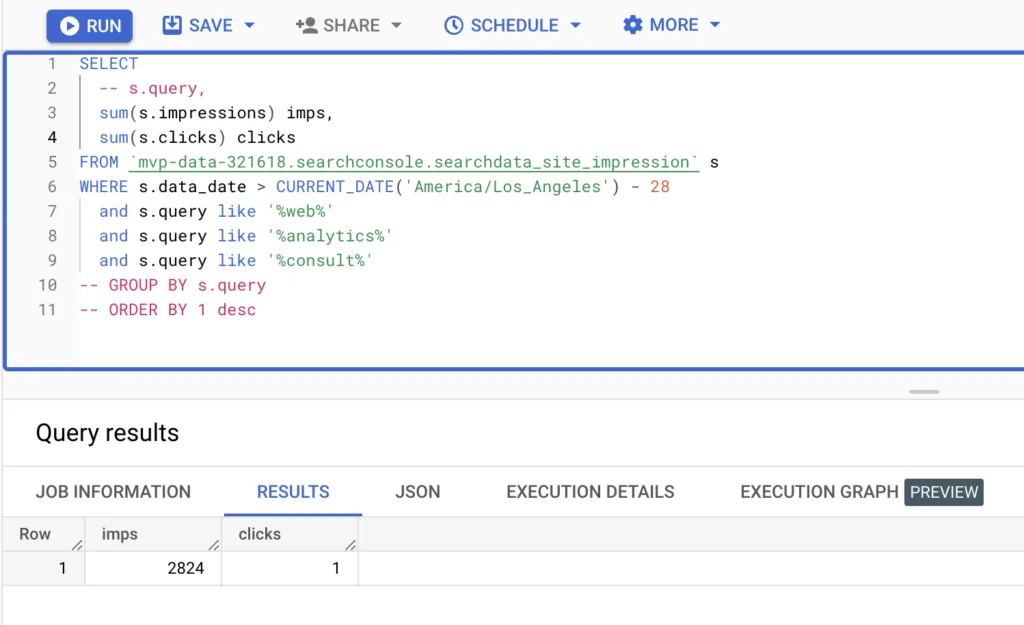
Luckily in BigQuery, you can apply as many filters as you like on a single dimension. Here’s an example of how I would aggregate impressions and clicks for all keywords that contain all three of the following tokens: “web,” “analytics,” and “consult” (as in “consulting or consultant.”)
If you uncomment the three commented lines, you’ll get stats aggregated by search query.
SELECT
 -- s.query,
 sum(s.impressions),
 sum(s.clicks)
FROM `mvp-data-321618.searchconsole.searchdata_site_impression` s
WHERE s.data_date > CURRENT_DATE('America/Los_Angeles') - 28
 and s.query like '%web%'
 and s.query like '%analytics%'
 and s.query like '%consult%'
-- GROUP BY s.query
-- ORDER BY 1 desc
💡 Notice the WHERE clause. Not only do I filter on the query, but I also filter in data from the last four weeks (using the timezone that Google Search Console uses for reporting). This is a useful time range, but it also reduces the amount of data scanned and thus reduces the cost of running the query!
Keyword variety per URL
The Google Search Console UI makes it easy to aggregate sums and percentages, but it is impossible to count how many distinct queries are leading to impressions for a given URL. Here’s a query to do just that.
SELECT
 u.url,
 COUNT(DISTINCT u.query) distinct_queries,
 SUM(u.impressions) imps,
 SUM(u.clicks) clicks
FROM `mvp-data-321618.searchconsole.searchdata_url_impression` u
WHERE u.data_date > CURRENT_DATE('America/Los_Angeles') - 28
GROUP BY u.url
ORDER BY 2 DESC
💡 Notice that I’ve used the DISTINCT keyword to count each unique query only once. If I hadn’t done this, I would have counted each query whether it was a duplicate or not.
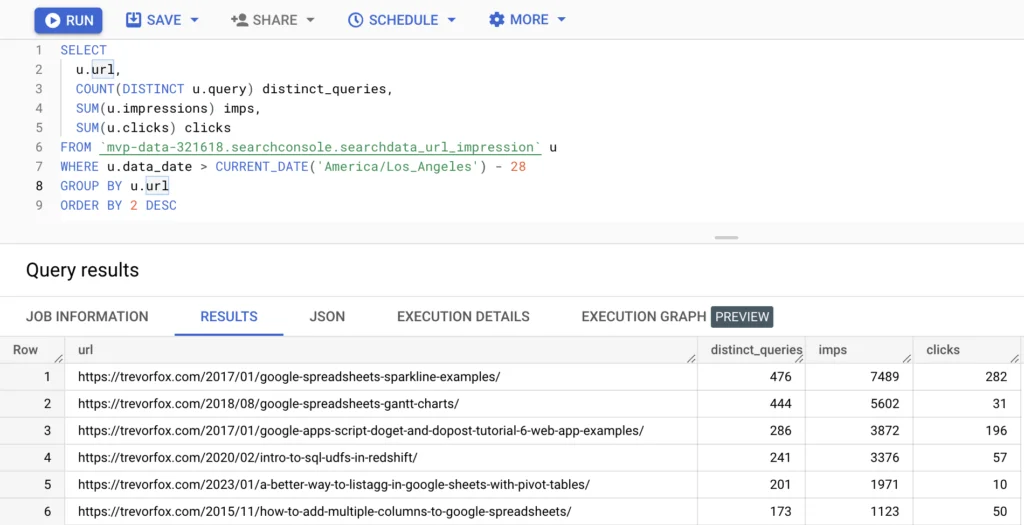
It’s interesting to see that the URLs with the most distinct queries are technical posts that probably have a lot of specific but infrequent queries about the topic. If you’ve ever heard about zero search volume queries that bring traffic, you’re looking at it!
How much site traffic is coming from anonymized queries?
The question about query variety begs another question. How many queries are coming in so infrequently that they are aggregated into the anonymized query bucket? Here’s a query to provide some statistics and insights about that.
SELECT
 u.url,
 SUM(u.impressions) total_imps,
 SUM(CASE WHEN u.is_anonymized_query = TRUE THEN u.impressions END) anonymized_imps,
 SUM(u.clicks) total_clicks,
 SUM(CASE WHEN u.is_anonymized_query = TRUE THEN u.clicks END) anonymized_clicks,
 ROUND(SUM(CASE WHEN u.is_anonymized_query = TRUE THEN u.impressions END) / SUM(u.impressions),2) pct_anonymized_imps,
 ROUND(SUM(CASE WHEN u.is_anonymized_query = TRUE THEN u.clicks END) / SUM(u.clicks),2) pct_anonymized_clicks
FROM `mvp-data-321618.searchconsole.searchdata_url_impression` u
WHERE u.data_date > CURRENT_DATE('America/Los_Angeles') - 28
GROUP BY u.url
HAVING
 total_imps > 1000
 AND total_clicks > 0
ORDER BY pct_anonymized_imps desc
💡 Using a CASE statement within an aggregate function (like SUM) filters in rows of data that evaluate to true. This is how I sum anonymized queries vs. all queries.
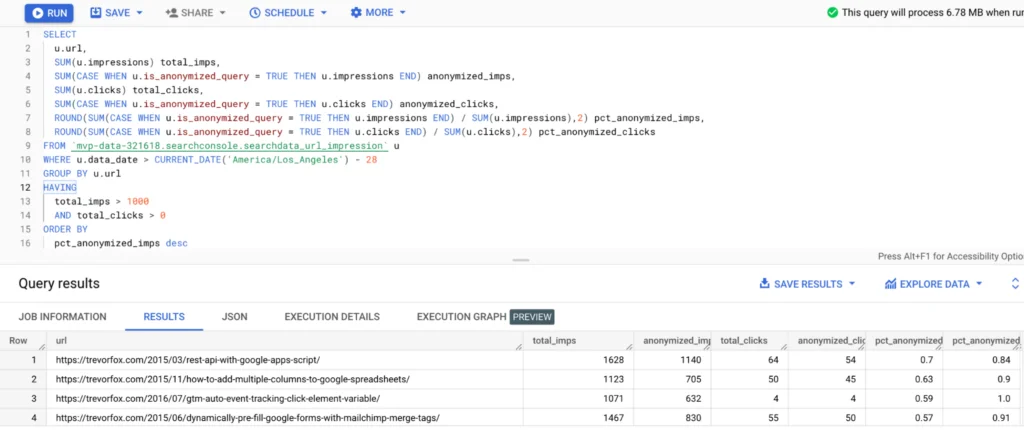
Does it surprise you that over half of the impressions are anonymized for several of these URLs? It makes me wonder what the opportunity is here. One idea could be to break these pages out into more specific topics to see if Google would rank them differently. Maybe not my best idea, but if you ask enough questions, you’re bound to find lots of leverage!
SQL Queries to search queries to …
Now it’s your turn. You have everything you need to know about the Google Search Console + BigQuery integration to get up and running, so start analyzing your data! If you want help getting set up or running analyses, I’m happy to help. And if anything is unclear or missing, please leave a comment!
Follow on LinkedIn
Pingback: SEO Analytics in SQL for Beginners: A step-by-step tutorial • Trevor Fox
Thanks for your post. While I can get the same metrics on impressions and clicks, I did not manage to reproduce the “average position” accurately. The closest I can get is by using the searchdata_site_impression and do SUM(sum_top_position) / SUM(impressions).
Try this: https://trevorfox.com/tools/gsql/ You can put in a GSC URL and it will write the SQL to get the same report. Here’s more instruction on that calculation too: https://trevorfox.com/2025/01/aggregating-position-metrics-and-ctr-curves/
Awesome, Trevor, the “+1” on the average did the trick. Thanks for the valuable resources, I will certain read more of your publications.
Happy to help!
How to view the Google search console indexing page errors like 404, 301, etc error on the big query?
That’s not available. There is no endpoint for it. It would be nice but the only place that’s available is in the Google Search Console UI.